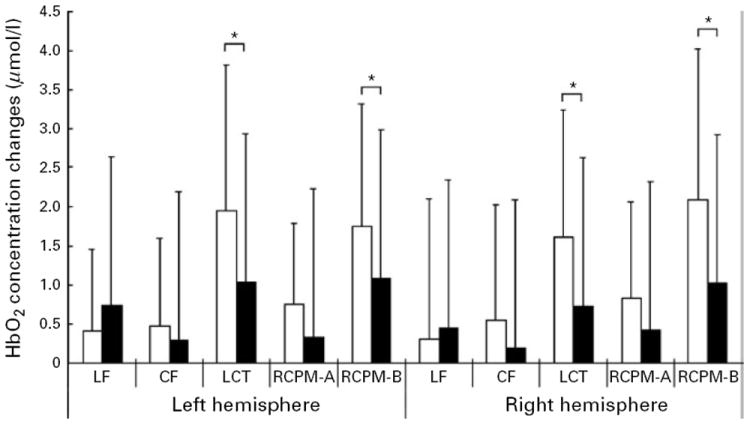
Fig. 3.

Changes from baseline in oxygenated hemoglobin (HbO2) concentration due to cognitive tasks in patients with bipolar disorders (□) and normal controls (■). Values are means, with standard deviations represented by vertical bars. LF, Letter fluency task; CF, category fluency task; LCT, letter cancellation test; RCPM-A, Set A of Raven’s Colored Progressive Matrices; RCPM-B, Set B of Raven’s Colored Progressive Matrices. * Post hoc analyses following a group × task × hemisphere analysis of variance on HbO2 concentration revealed that the bipolar disorder group showed a greater increase in HbO2 concentration in the LCT and in RCPM-B, relative to controls (p<0.005).
