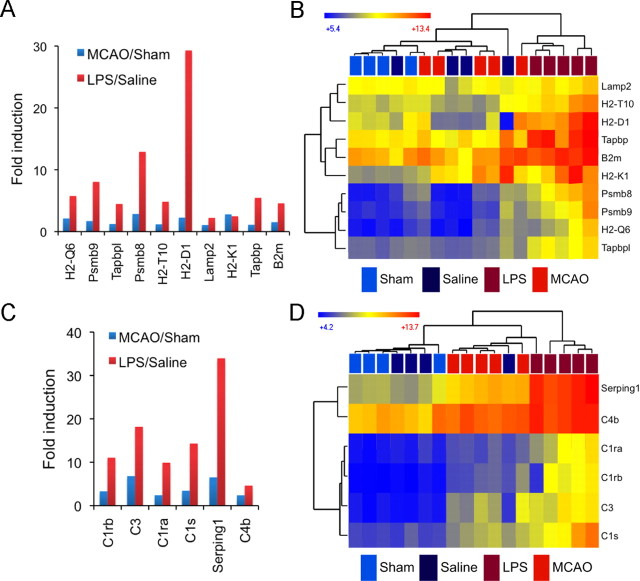
Figure 10.
LPS reactive astrocytes more highly induce the antigen presentation and complement pathways. A, The fold induction of antigen presentation pathway genes in MCAO reactive astrocytes (blue) and LPS reactive astrocytes (red) is shown. All replicates within a class were averaged to obtain the fold induction. Antigen presentation pathway genes are induced 2- to 30-fold in LPS reactive astrocytes but only 10% to threefold in MCAO reactive astrocytes. B, A heat map was generated by hierarchical clustering using antigen presentation pathway genes. The distance on the dendrogram between resting and reactive astrocyte population replicates is represented in Euclidean distance. The heat map indicates relative expression where blue indicates lower expression and red indicates higher expression. LPS reactive astrocytes cluster separate from other astrocyte populations. C, The fold induction of complement pathway genes in MCAO reactive astrocytes (blue) and LPS reactive astrocytes (red) is compared. Complement genes are induced 4.5- to 34-fold in LPS reactive astrocytes but only 2.4- to 6.8-fold in MCAO reactive astrocytes. D, Four of the five LPS reactive astrocyte replicate clusters separate from other astrocyte populations on the basis of their complement pathway gene expression. MCAO reactive astrocytes, one LPS replicate, and one quiescent replicate show an intermediate induction of complement pathway expression.

