Figure 4.

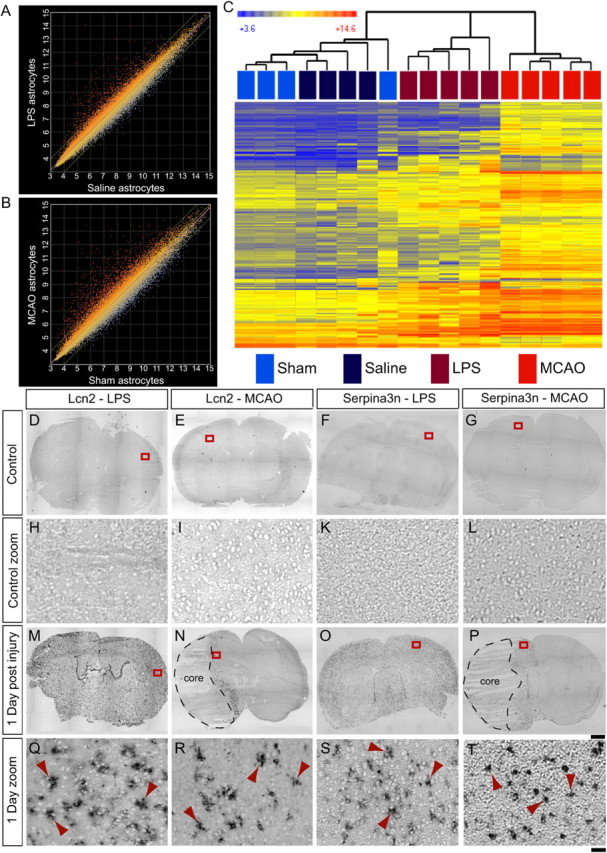
GeneChip analysis of reactive astrocyte populations suggests new markers of reactive astrocytes. A, B, The relative expression, on a log2 scale, of all probe sets from the Affymetrix GeneChip Mouse Genome 430 2.0 arrays is represented on scatter plots. Expression by astrocytes from LPS-injected animals was compared with that by astrocytes from saline-injected animals (A), and expression by astrocytes from animals that had undergone MCAO was compared with that by astrocytes from animals that had undergone sham surgeries (B). Reactive astrocyte populations on the y-axis are compared with quiescent astrocyte populations on the x-axis. Each dot represents a probe set. Probe sets that are induced in LPS and MCAO reactive astrocytes are represented by red dots; probe sets that are repressed in LPS and MCAO reactive astrocytes are represented by blue dots. C, A heat map was generated by hierarchical clustering using the 263 genes whose expression is significantly induced more than fourfold at 1 d after injury. The dendrogram of the quiescent and reactive astrocyte replicates is represented in Euclidean distance. The relative expression of each probe set is indicated by color intensity, where blue indicates lower expression and red indicates higher expression. D–T, In situ hybridization with probes for two identified reactive astrocyte markers was done on fresh frozen coronal brain sections from healthy (D–G, zoom in H–L) and injured (M–P, zoom in Q–T) mice. Control sections from saline-injected and sham-operated mice do not have expression of either Lcn2 (H and I are zoom of boxes in D and E) or Serpina3n (K and L are zoom of boxes in F and G). Lcn2 is expressed in astrocytes throughout the cortex 1 d after LPS injection (Q is zoom of box in M) and in the astrocytes of the lesion penumbra 1 d after MCAO (R is zoom of box in N). Serpina3n in expressed in astrocytes 1 d after LPS injection (S is the zoom of box in O) or MCAO (T is the zoom of box in P). Red arrowheads indicate cells with astrocyte stellate morphology (Q–T). Scale bars: D–G, M–P, 1000 μm; H–L, Q–T, 50 μm.
