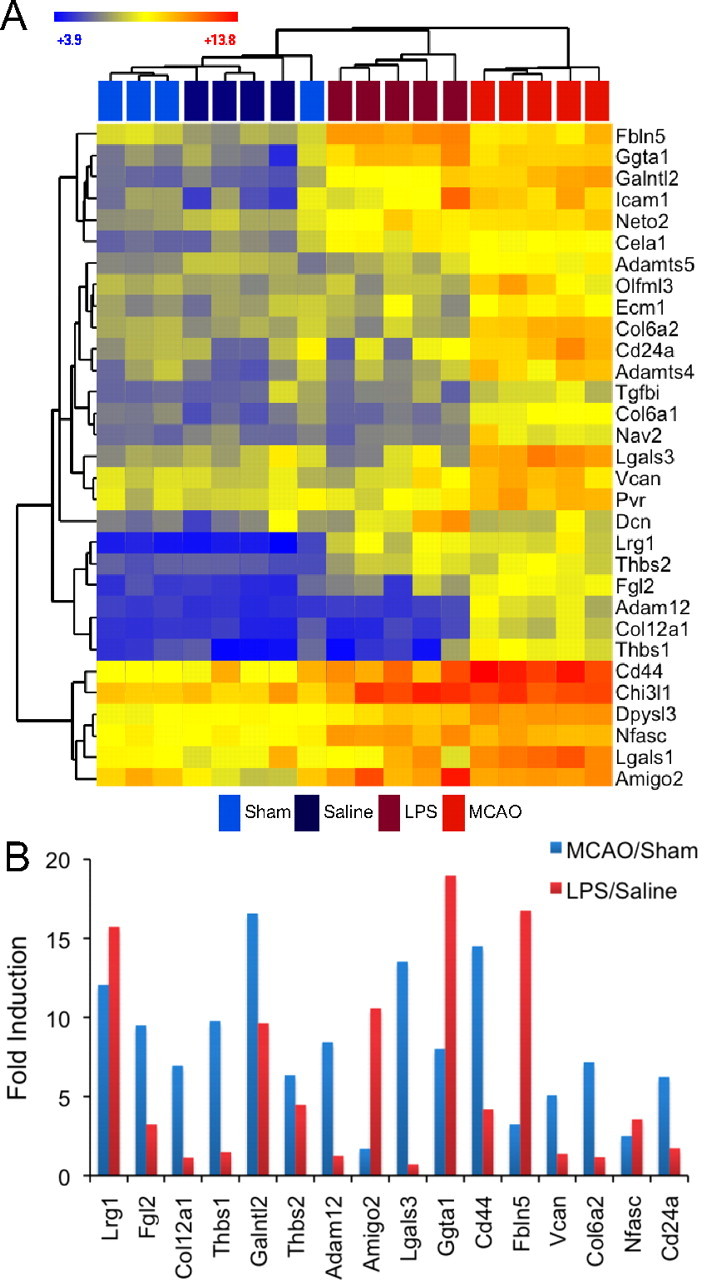
Figure 8.

MCAO reactive astrocytes and LPS reactive astrocytes express differing levels of extracellular binding/adhesion/modification genes. A, A heat map was generated by hierarchical clustering using extracellular binding/adhesion/modification genes whose expression was significantly induced more than fourfold at 1 d after either injury. The dendrogram of the quiescent and reactive astrocyte replicates is represented in Euclidean distance. Relative expression is shown where blue indicates lower expression and red indicates higher expression. LPS reactive astrocytes and MCAO reactive astrocytes modify the extracellular space in distinct ways. B, The bar graph shows the fold induction of genes within the class in MCAO reactive astrocytes (blue) and LPS reactive astrocytes (red). All replicates within a class were averaged to obtain the fold induction. Although there are similarities between MCAO and LPS reactive astrocytes, there are extensive differences in gene expression induction patterns between them.
