Figure 9.

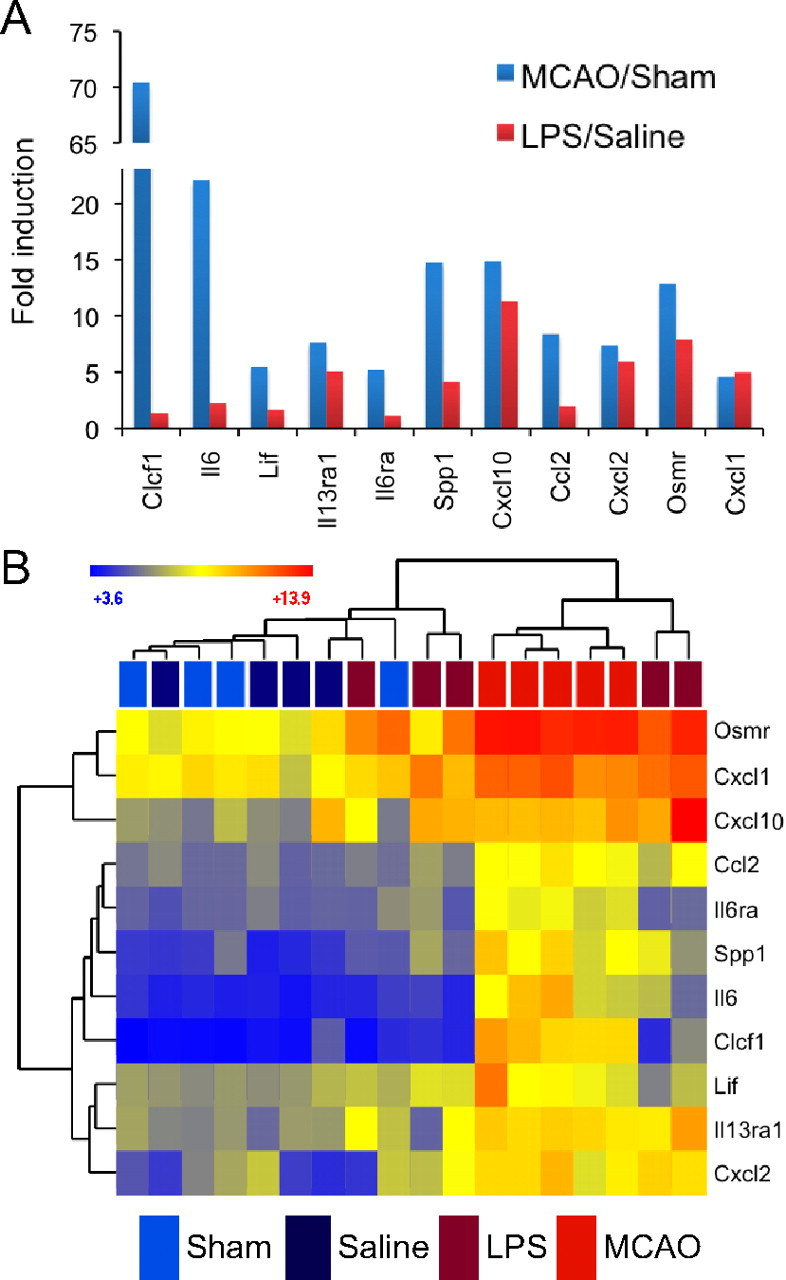
MCAO reactive astrocytes and LPS reactive astrocytes express differing levels of cytokine signaling genes. A, The bar graph shows fold induction of cytokine signaling genes in MCAO reactive astrocytes (blue) and LPS reactive astrocytes (red). All replicates within a class were averaged to obtain the fold induction. Pro-inflammatory cytokines CXCL1, CXCL2, and CXLC10 are similarly induced in both MCAO and LPS reactive astrocytes. The neurotrophic cytokines LIF, IL6, and CLCF1 and macrophage chemokine CCL2 are more strongly induced in MCAO reactive astrocytes. B, A heat map was generated by hierarchical clustering of resting and reactive astrocyte populations using cytokine signaling genes whose expression is significantly induced more than fourfold at 1 d after either injury. The dendrogram of astrocyte replicates is represented in Euclidean distance. The heat map indicates relative expression where blue indicates lower expression and red indicates higher expression. Variability in reactive astrocyte response to injury occurs even within an injury model. Two replicates of LPS reactive astrocytes cluster more closely with the MCAO reactive astrocytes, and one replicate has an expression pattern that places it within the quiescent astrocytes cluster.
