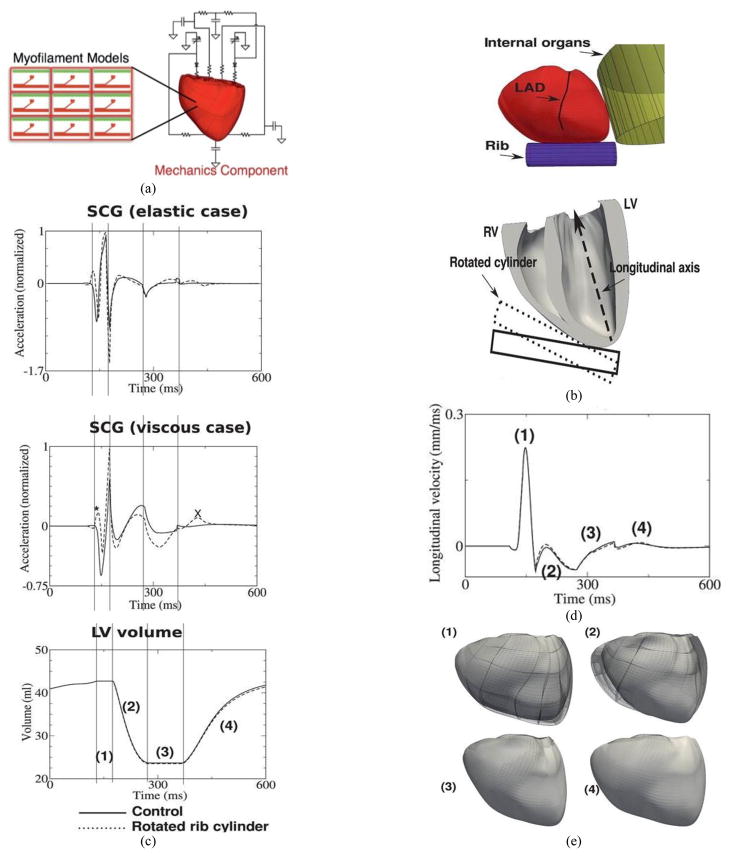
Figure 2.
Electromechanical model of ventricular contraction and simulation of SCG signal. (a). Diagram of electromechanical model coupled with the model of blood circulation in the body. (b). Location of rib and thoracic organs in the model. (c). Temporal traces of acceleration in the elastic case (top), acceleration in the viscous case (middle), and LV volume (bottom). Asterisk and X highlight changes in SCG morphology due to rotated rib. (d). Longitudinal displacement velocity of LV apex. (e). Deformations of the ventricles during the phases of the cardiac cycle (view from the anterior surface). Notations: (1) – isovolumic contraction, (2) – ejection phase, (3) – isovolumic relaxation, (4) – ventricular filling, LAD – left anterior descending coronary artery. MC – mitral valve closing, AO – aortic valve opening, RE – rapid ejection. In all figures, solid and dashed lines represent simulations for control and rotated rib orientation, respectively.

