
Figure 12.
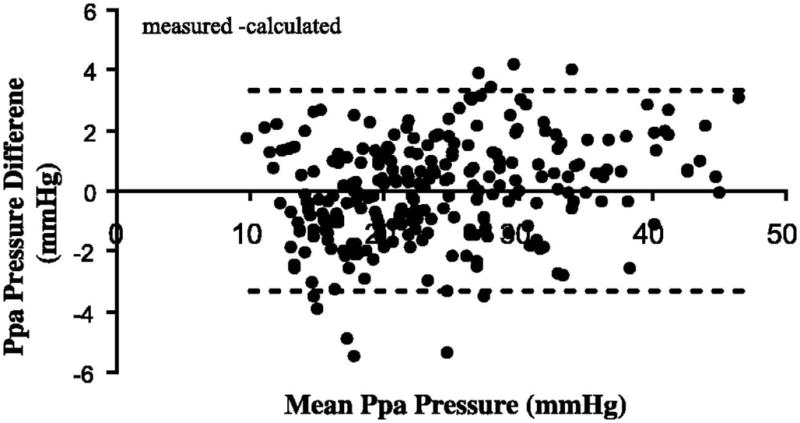
Predicted minus measured mean pulmonary artery pressure (Ppa) as a function of mean Ppa in healthy exercising volunteers. The stippled line shows 2 SD, which is equal to 1.7 mmHg. This presentation is suggestive of a good agreement. The prediction of Ppa was obtained using the distensibility model of Linehan. From reference 182.