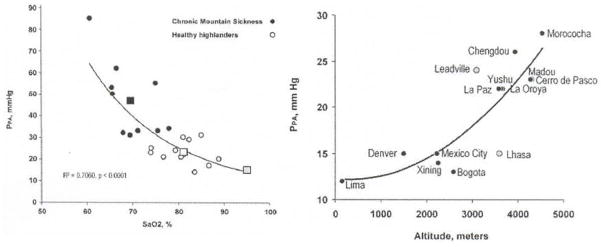
Figure 16.
Curvilinear relationships between mean pulmonary artery pressure (PPA) and arterial oxygen saturation (SaO2) in healthy highlanders (empty symbols) and highlanders with chronic mountain sickness (full symbols), left palel, and between mean pulmonary artery pressure (PPA) and altitude of locations (right panel). Extremes are observed in Lhasa and in Leadville. Hypoxia is a major determinant of Ppa, but there is ethnic variability. From reference 172. Permission pending.

