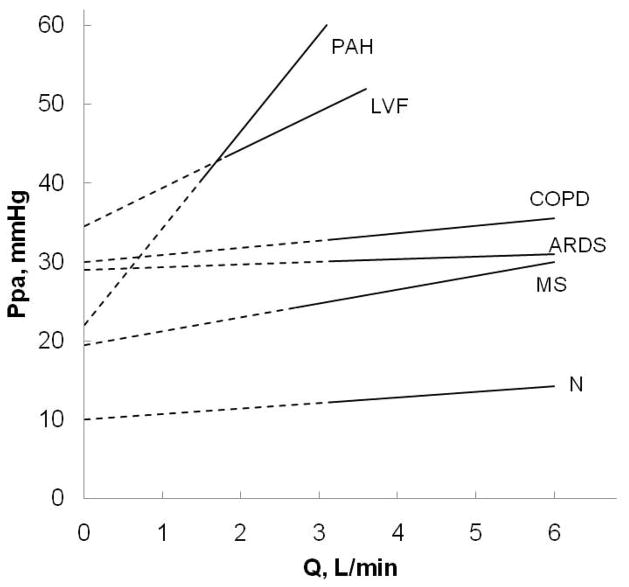
Figure 20.
Two point mean pulmonary artery pressure (Ppa) cardiac output (Q) plots in normal subjects (N), or patients with mitral stenosis (MS), acute respiratory distress syndrome (ARDS), chronic obstructive pulmonary disease (COPD), left ventricular failure (LVF) and pulmonary arterial hypertension (PAH). All Ppa-Q plots are shifted upward to higher pressure with an increased extrapolated pressure intercept (stippled lines). Left atrial pressure was equal to the extrapolated pressure intercept in LVF. Contructed with mean data reported in references 50,83,103,106,160,241.

