
Figure 9.
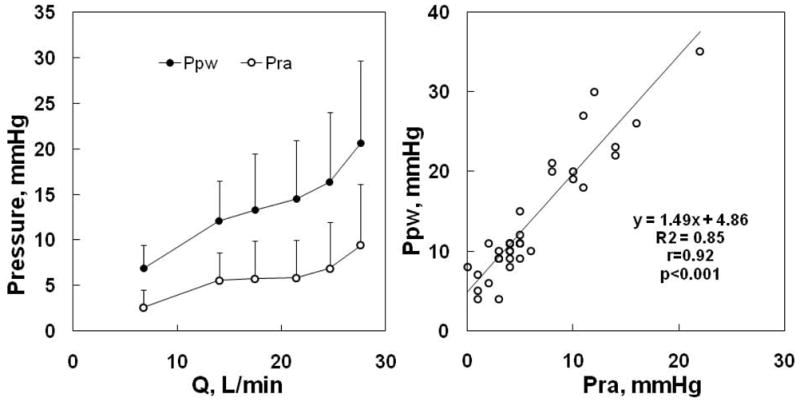
Mean ± SD (vertical bars) values of mean pulmonary artery wedge pressure (Ppw) and right atrial pressure (Pra) as a function of cardiac output (Q) during progressive exercise in normal volunteers, left panel, and Ppw vs Pra of the same subjects, right panel. Both Ppw and Pra increase with Q, but the gradient between the pressures tended to increase. The right panel shows that Ppw is correlated to Pra, but is higher than Pra by 5 mmHg at rest, and this increases with a slope of 1.45 mmHg increase in Ppw for every mmHg increase of Pra at exercise. From references 180 and 181.