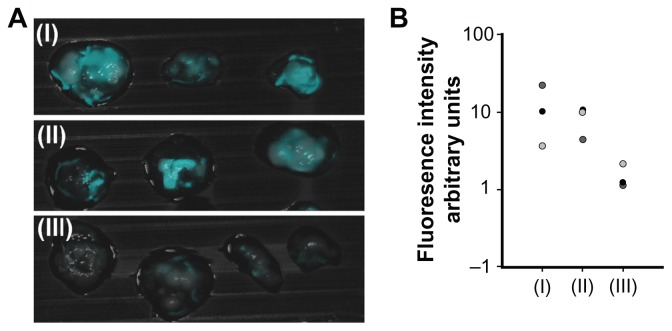
Figure 7.
Fluorescence imaging of tumors on chicken embryo chorioallantoic membrane. (A) Merged fluorescent and bright light images of a typical experiment involving a LS174T tumor cell line implanted in chicken embryo chorioallantoic membrane treated with peanut agglutinin-conjugated (I), anticarcinoembryonic antigen antibody-conjugated (II), and glycine (III)-conjugated iron oxide-human serum albumin near-infrared fluorescent nanoparticles. (B) Quantification of the fluorescence intensity of the tumors averaged over the surface area as calculated by ImageJ software.
Notes: Vertical axis is logarithmically scaled. This experiment was repeated three more times with similar results.

