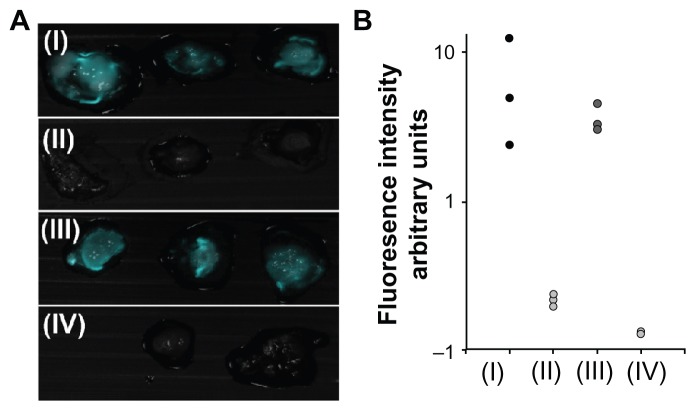
Figure 8.
Fluorescence imaging of tumors on chicken embryo chorioallantoic membrane. (A) Merged fluorescent and bright light images of a typical experiment involving peanut agglutinin-conjugated or anticarcinoembryonic antigen antibody-conjugated iron oxide-human serum albumin NIR fluorescent nanoparticles topically administered to LS174T (I and III, respectively) and SW480 (II and IV, respectively) tumor cell lines implanted on chicken embryo chorioallantoic membrane. (B) Quantification of fluorescence intensity of tumors averaged over the surface area, as calculated by ImageJ software.
Notes: Vertical axis is logarithmically scaled. This experiment was repeated three more times with similar results.

