Fig. 4.

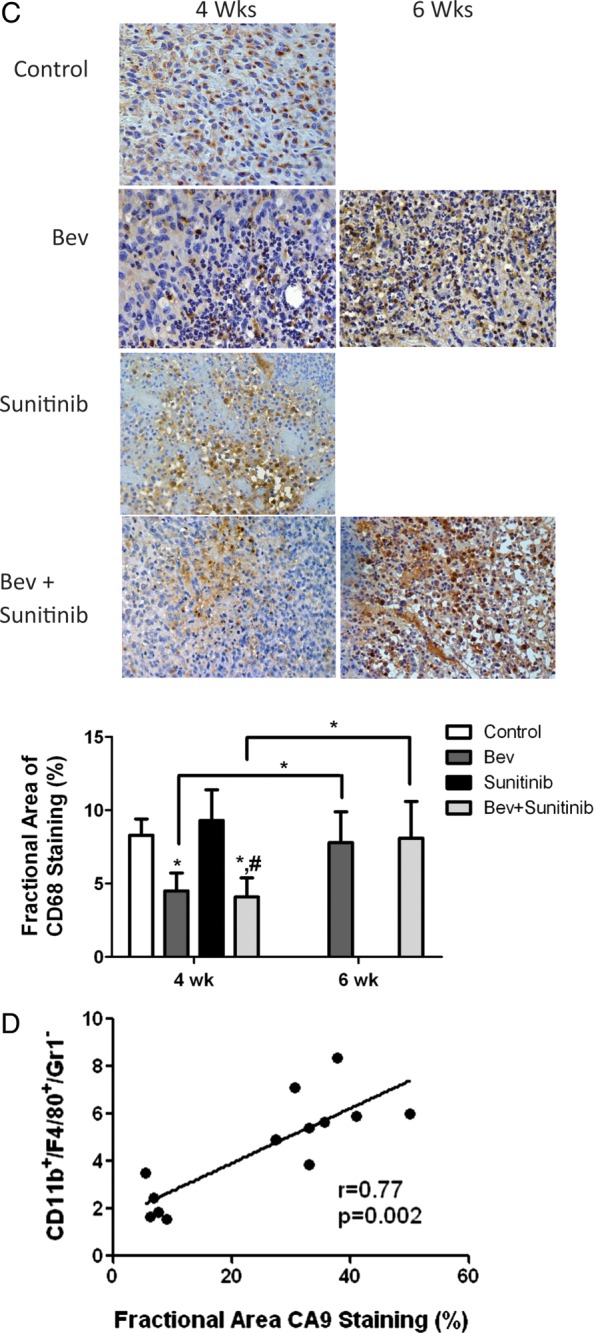
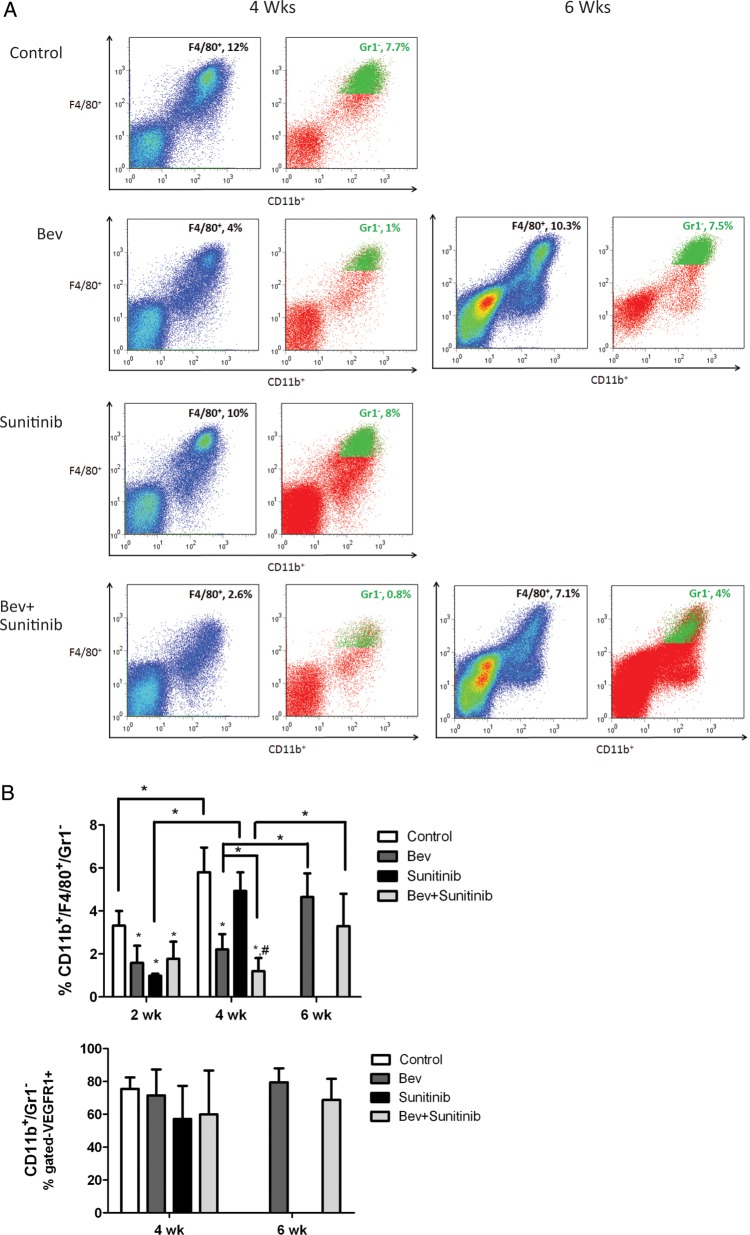
Antiangiogenic agents modulate CD11b+/F4/80+/Gr1− myeloid cell recruitment to tumors. (A) Representative flow cytometry analyses from tumor at 4 and 6 weeks in each group. (B) Upper panel, bar graph demonstrating the average percentage of CD11b+/F4/80+/Gr1- myeloid cells at each time point for the 4 treatment groups. Lower panel, bar graph showing average percentage of CD11b+/Gr1- cells expressing VEGFR1+. (C) Top, representative photomicrographs of CD68 macrophage staining at the corresponding time points. Bottom, bar graph of fractional area of CD68 staining. *P < .05 compared with controls; #P < .05 compared with sunitinib treated animals. (D) Positive correlation between number of CD11b+/F4/80+/Gr1- macrophages using flow cytometry and fractional area of CA9 staining.

