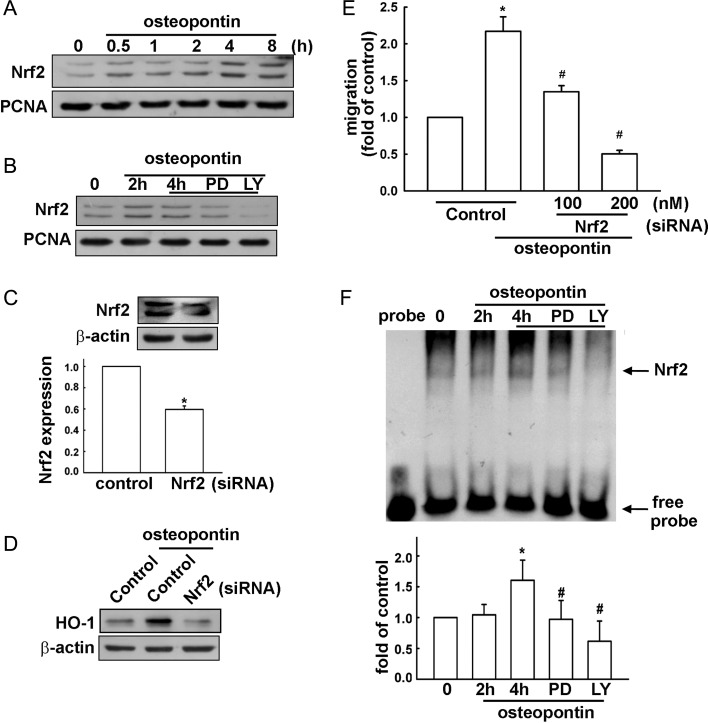
Fig. 5.
Osteopontin-induced HO-1 upregulation involves Nrf2 activation in U251 glioma cells. (A) Cells were treated with osteopontin for the indicated time periods, and the level of nuclear Nrf2 expression was determined by immunoblotting with Nrf2-specific antibody. (B) Cells were treated with ERK or Akt inhibitors for 30 min followed by stimulation with osteopontin for 4 h, and the level of nuclear Nrf2 expression was determined by immunoblotting with Nrf2 specific antibody. Cells were transfected with control or Nrf2 siRNA for 24 h, and Nrf2 (C) and HO-1 protein expressions (D) were determined by Western blot; osteropontin-induced cell migration was measured in the transwell assay (E). Results are expressed as means ± SEM of 3 independent experiments. *P < .05 compared with the control group; #P < .05 compared with the osteopontin treatment group. (F) Nuclear extracts were collected from cells treated with osteopontin for the indicated time periods (2 h or 4 h), and the binding of Nrf2 to the Nrf2-DNA binding element was examined by EMSA analysis. Lane 1 was loaded without nuclear extracts (probe). Cells were pretreated with PD98059 or LY294002, were treated with osteopontin for 4 h, and were then analyzed by EMSA. The quantitative data are shown in the lower panel. *P < .05 compared with the control group; #P < .05 compared with the osteopontin treatment for 4 h. Note that osteopontin increases the binding of Nrf2 to the Nrf2-DNA binding element, and treatment with PD98059 and LY294002 reduced osteopontin-increased DNA binding activity of Nrf2. Results are expressed as means ± SEM of 3 independent experiments. *P < .05 compared with the control group; #P < .05 compared with the osteopontin treatment for the 4 h group.

