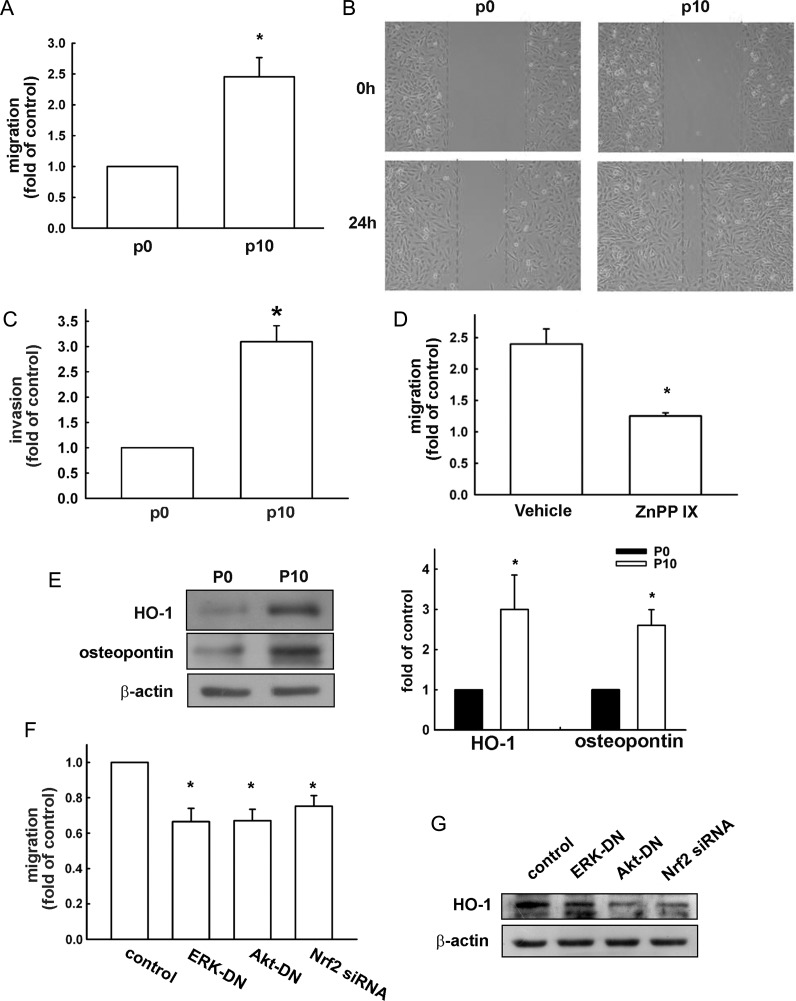
Fig. 6.
Upregulation of osteopontin and HO-1 expression in migration-prone cells. (A) After 10 rounds of selection of U251 cells by a cell culture insert system, the migration-prone subline (P10) exhibited higher migration ability than the original U251 cells. Results are expressed as means ± SEM of 3 independent experiments. *P < .05 compared with the original group (P0). (B) The original U251 cells (P0) and the migration-prone subline (P10) were seeded for 24 h, and cell migration was determined by wound-healing assay and visualized by phase-contrast imaging. (C) The migration-prone subline (P10) exhibited higher invasion ability than the original U251 cells. Results are expressed as means ± SEM of 3 independent experiments. *P < .05 compared with the control group. (D) Treatment with ZnPPIX (0.3 μM) for 24 h reduced the migration ability of the migration-prone subline (P10) compared with the vehicle treatment. Results are expressed as means ± SEM of 3 independent experiments. *P < .05 compared with the control group (vehicle treatment). (E) The cell lysates of P10 and the original U251 glioma cells (P0) were collected after 24 h of culturing, and osteopontin and HO-1 protein levels were determined using Western blot analysis. Note that P10 expressed higher osteopontin and HO-1 protein levels. The quantitative results are shown in the right panel. Results are expressed as means ± SEM of 3 independent experiments. *P < .05 compared with the P0 group. P10 cells were pretransfected with ERK-DN, Akt-DN, or Nrf-2 siRNA for 24 h, cell migration activity was determined by a cell culture insert system (F), and HO-1 expression was examined by Western blot (G).

