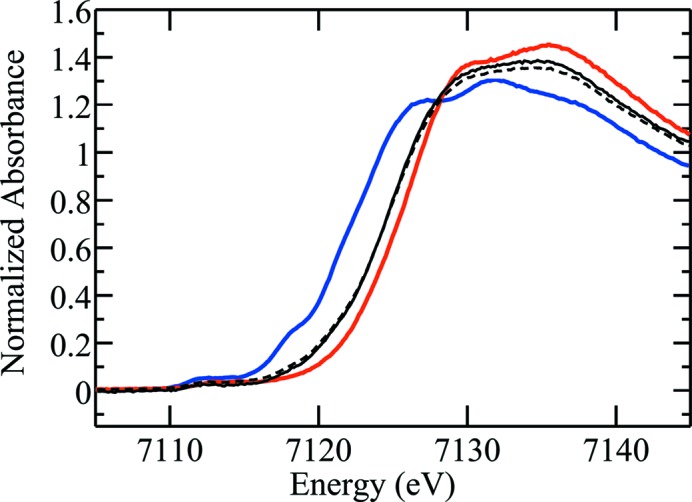
Figure 7.

X-ray absorption near-edge spectra of deoxy- and met-myoglobin compared with met-myoglobin data from the Australian Synchrotron (AS). The blue and red lines show the spectra of deoxy-myoglobin and met-myoglobin, respectively. These data were recorded in 1996 on BL7-3 at SSRL at 10 K. These are compared with the first (solid black line) and third (broken black) scans of met-myoglobin prepared in the same way but recorded on the XAS beamline at the AS, showing substantial and almost complete photo-reduction to a metastable Fe(II) complex during the first scan.
