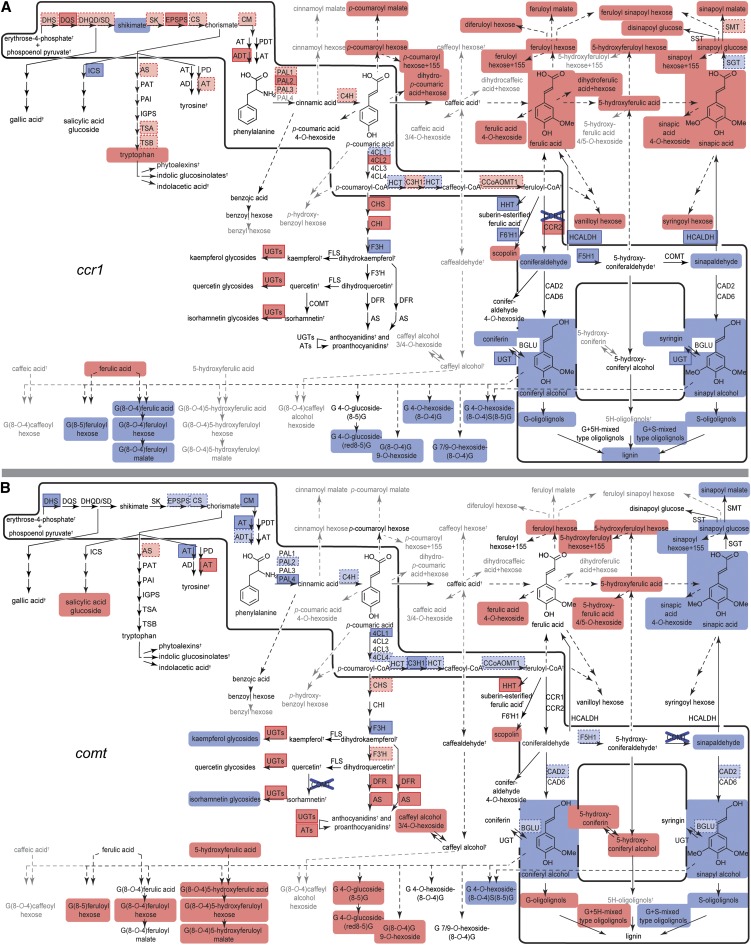
Figure 5.
Metabolic Shifts in Phenolic Metabolism as a Result of a Mutation in the Lignin Biosynthetic Pathway.
The relative increase and decrease of transcript and metabolite abundances in each of the mutants compared with WT24cm was mapped manually on the pathway as discrete features. Differences in metabolites are indicated via round-angled boxes, where red represents a significant increase and blue a significant decrease in abundance. Differences in transcript abundance are indicated with right-angled, framed boxes: significant increases and decreases are visualized via red and blue boxes with solid borders, respectively, whereas tendencies [log2(abundance in the sample/abundance in WT24cm)<−0.3 or >0.3] are visualized via boxes with a pale fill and dashed-line borders. Metabolites that were below detection limit are given in gray. The effects in the ccr1 and comt mutants are in (A) and (B), as indicated. The metabolic shifts in phenolic metabolism of pal1, pal2, c4h, 4cl1, 4cl2, ccoaomt1, f5h1, cad6, and the wild-type developmental stages are given in Supplemental Figure 5 online. For abbreviations, see Figure 1.

