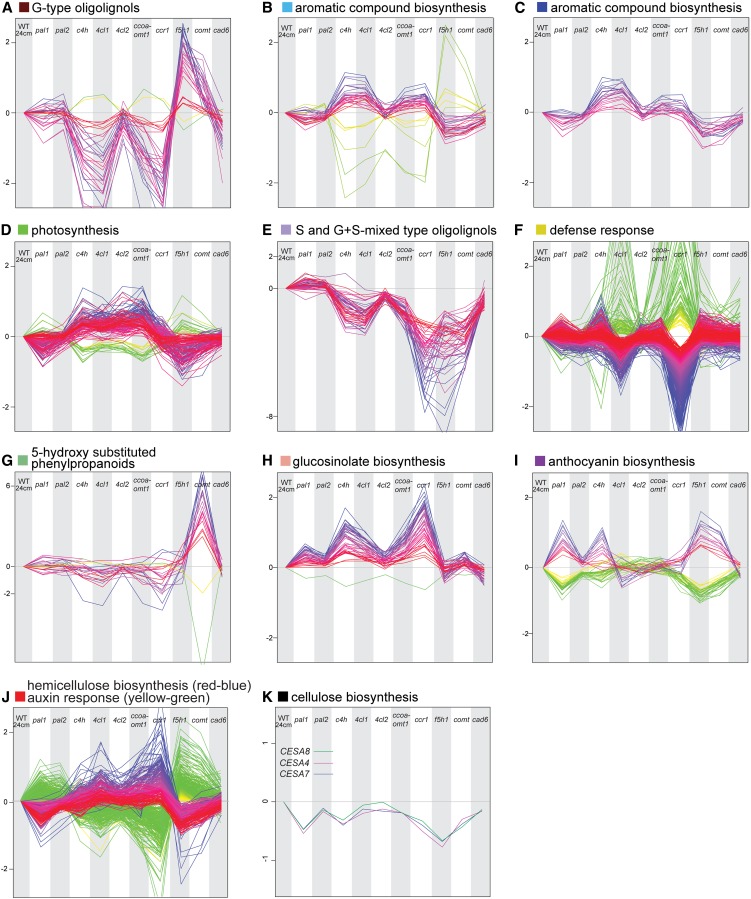
Figure 8.
Abundance Profiles of Transcripts and Metabolites in Subnetworks A to J from the Pearson Correlation Network in Figure 7.
(A) to (J) The color of the squares after the letters A to J is consistent with Figure 7. The two groups of profiles that were negatively correlated with each other, but part of the same subnetwork, are indicated in contrasting colors (i.e., red-blue and yellow-green). The names above the profiles of the nodes within each subnetwork refer to the most significant GO class in case of transcript or to the metabolic class in case of compounds. Unless otherwise indicated, a significant enrichment was found only for the red-blue profiles. WT, the wild type.
(K) The expression profile of genes coding for the three subunits of cellulose synthases involved in secondary cell wall formation.

