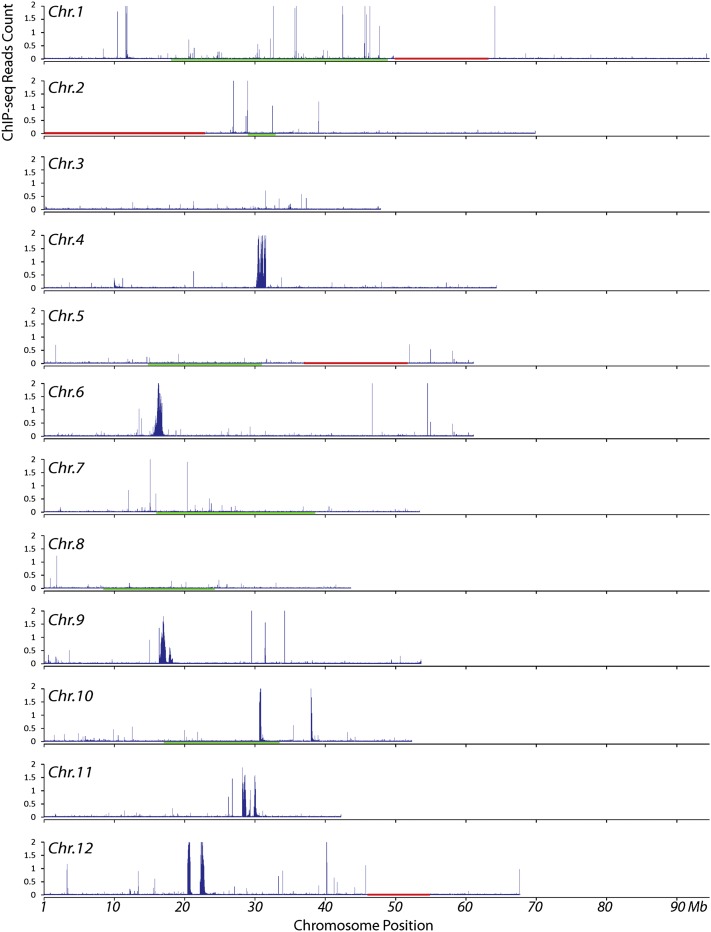
Figure 2.
Density of Sequence Reads Derived from ChIP with CENH3 Antibodies along Individual Potato Chromosomes.
Read density was represented by the total number of sequence reads in a 10-kb window per base pair mappable region. The x axes show the position on the chromosome. Red horizontal bars mark large physical gaps (>1 Mb) in the pseudomolecules. The red horizontal bar on chromosome 2 represents the unassembled 45S ribosomal gene cluster. The genetic positions of the centromeres of chromosomes 1, 2, 5, 7, 8, and 10 are likely spanned by the green horizontal bars that mark the recombination-suppressed domains on the corresponding linkage maps of these chromosomes (Felcher et al., 2012).

