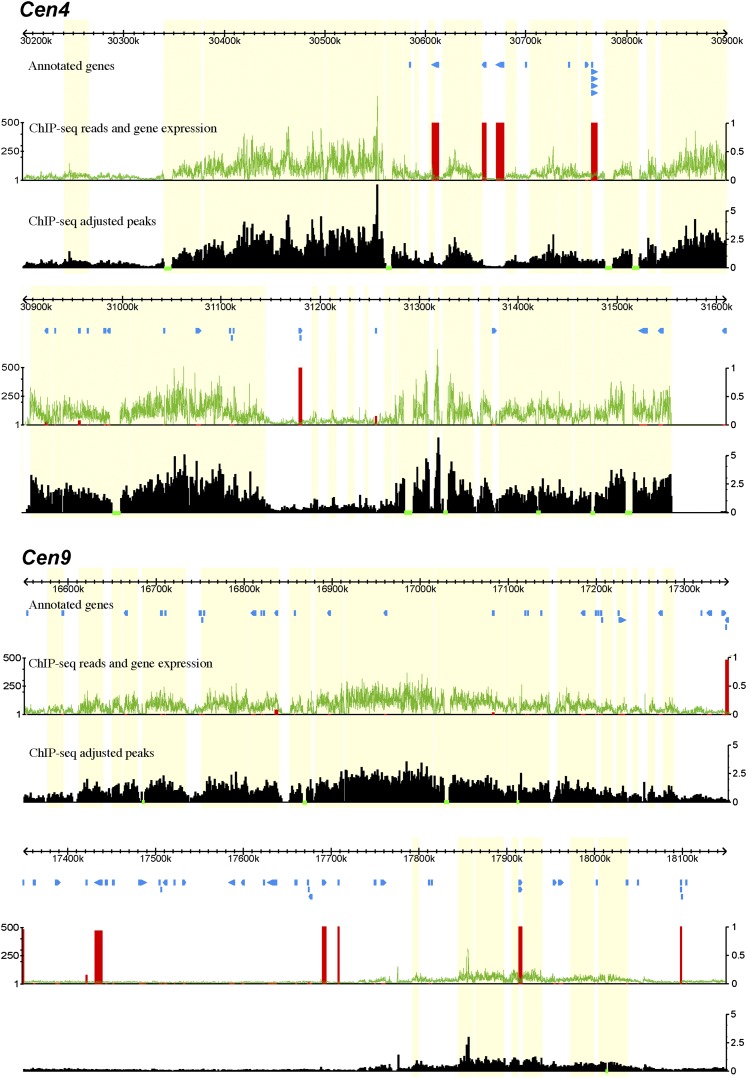
Figure 3.
Fine Structure of the Functional Cores of Potato Cen4 and Cen9.
The top track in each panel shows the sequence coordinates on the respective potato chromosome. The “annotated genes” track illustrates the positions of annotated genes. The green line in the middle track shows the number of sequence reads derived from ChIP with CENH3 antibodies in 100-bp windows. The vertical red bars represent the percentage of the 32 tissues in which the corresponding gene is expressed (FPKM >0) (1 representing expression in all 32 tissues). The bottom track shows the density of reads in 100-bp windows, adjusted by the length of mappable regions. The horizontal green bars in this track mark the sequencing gap/nonmappable regions. Each green bar region is assigned to an adjacent CENH3 subdomain. All CENH3 subdomains are shaded in yellow.

