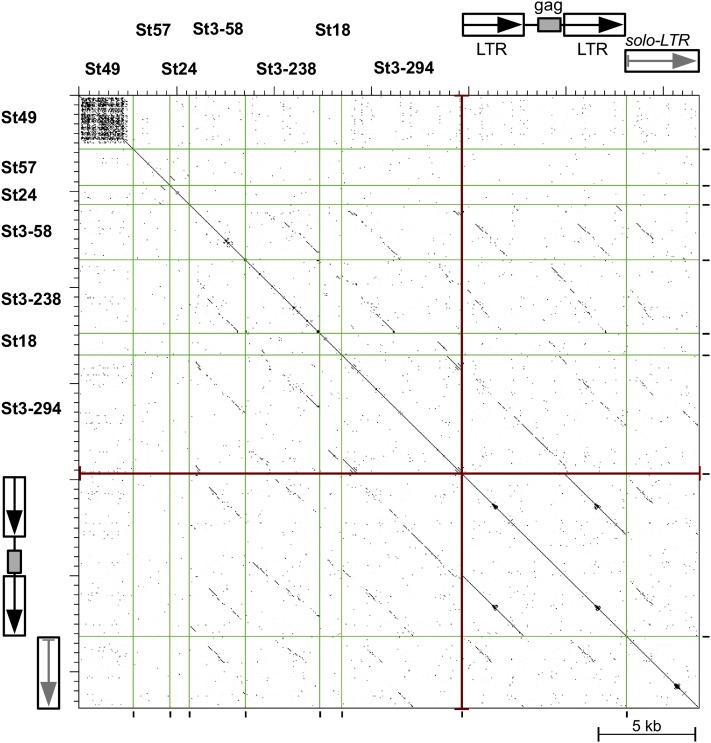
Figure 7.
Dot-Plot Similarity Comparison of Potato Centromeric Satellite Sequences and Selected Retrotransposon-Like Sequences.
Individual sequences are separated by vertical lines and their similarities exceeding 60% over a 100-bp sliding window are displayed as black dots or diagonal lines. The retrotransposon-like sequences with similarities to St3 and St18 satellites are represented by nonautonomous LTR retroelement (NA-RE) and related solo-LTR sequence, both identified in potato BAC clone BA251C18 (GenBank accession number GU906238, positions 23518-24812/28493-35636 and 24813-28492, respectively).
[See online article for color version of this figure.]

