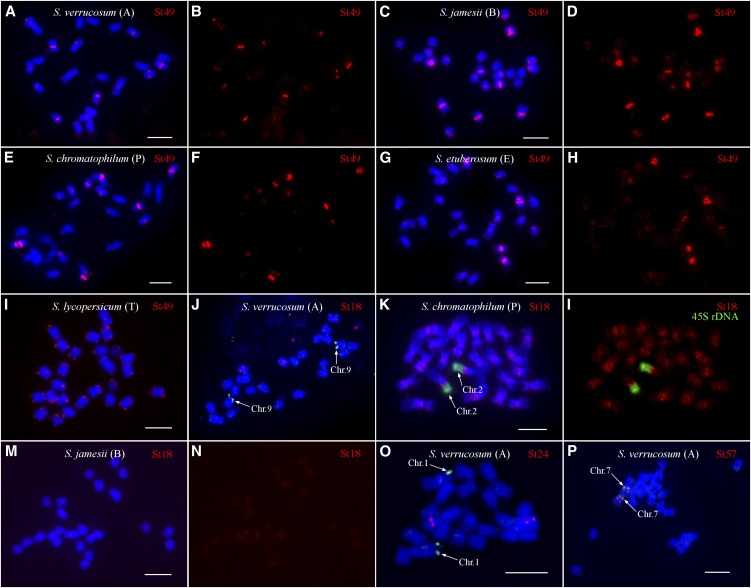
Figure 9.
FISH Mapping of Potato Centromere-Specific Satellite Repeats in Different Solanum Species.
(A) FISH of St49 on metaphase chromosomes of S. verrucosum.
(B) Digitally separated FISH signals from (A).
(C) FISH of St49 on metaphase chromosomes of S. jamesii.
(D) Digitally separated FISH signals from (C).
(E) FISH of St49 on metaphase chromosomes of S. chromatophilum.
(F) Digitally separated FISH signals from (E).
(G) FISH of St49 on metaphase chromosomes of S. etuberosum.
(H) Digitally separated FISH signals from (G).
(I) FISH of St49 on metaphase chromosomes of tomato (S. lycopersicum).
(J) FISH of St18 on metaphase chromosomes of S. verrucosum. St18 is not located on chromosome 9, which is identified by BAC 135I22 (arrows).
(K) FISH of St18 on metaphase chromosomes of S. chromatophilum. Chromosome 2 is identified by the FISH signals from 45S rDNA (arrows).
(L) Digitally separated FISH signals from (K).
(M) FISH of St18 on metaphase chromosomes of S. jamesii.
(N) Digitally separated FISH signals from (M).
(O) FISH of St24 on metaphase chromosomes of S. verrucosum. St24 is not located on chromosome 1, which is identified by BAC 96H03 (arrows).
(P) FISH of St57 on metaphase chromosomes of S. verrucosum. St57 is colocalized on chromosome 7, which is identified by BAC 186I02 (arrows).
Letters in parentheses represent the genome of the Solanum species. Bars = 5 μm.

