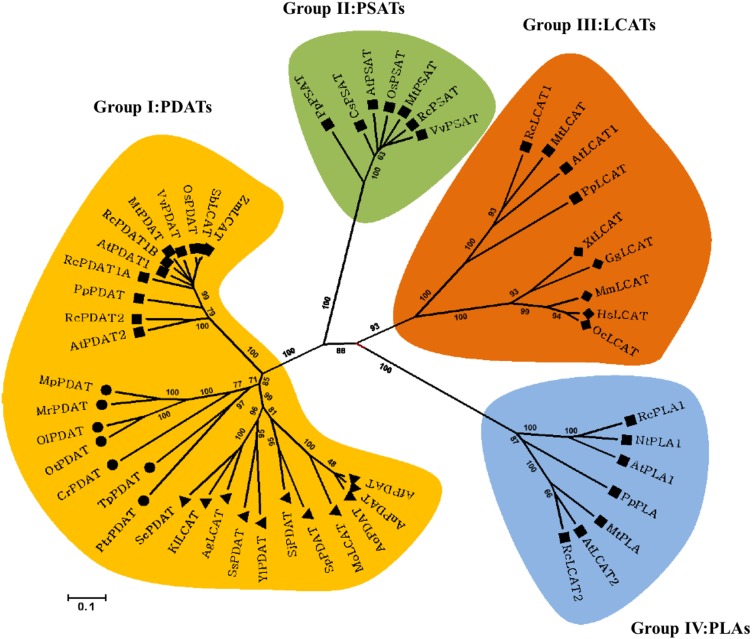
Figure 1.
Cladogram of the LCAT-Like Family Proteins from Plants, Fungi, Microalgae, and Animals.
The neighbor-joining method was used to reconstruct the cladogram. The bootstrap value (obtained from 1000 replicates) is shown on each node. The 0.1 scale represents 10% divergence, calculated as the estimated number of replacement. Squares, plants; triangles, fungi; circles, microalgae; diamonds, animals.
[See online article for color version of this figure.]

