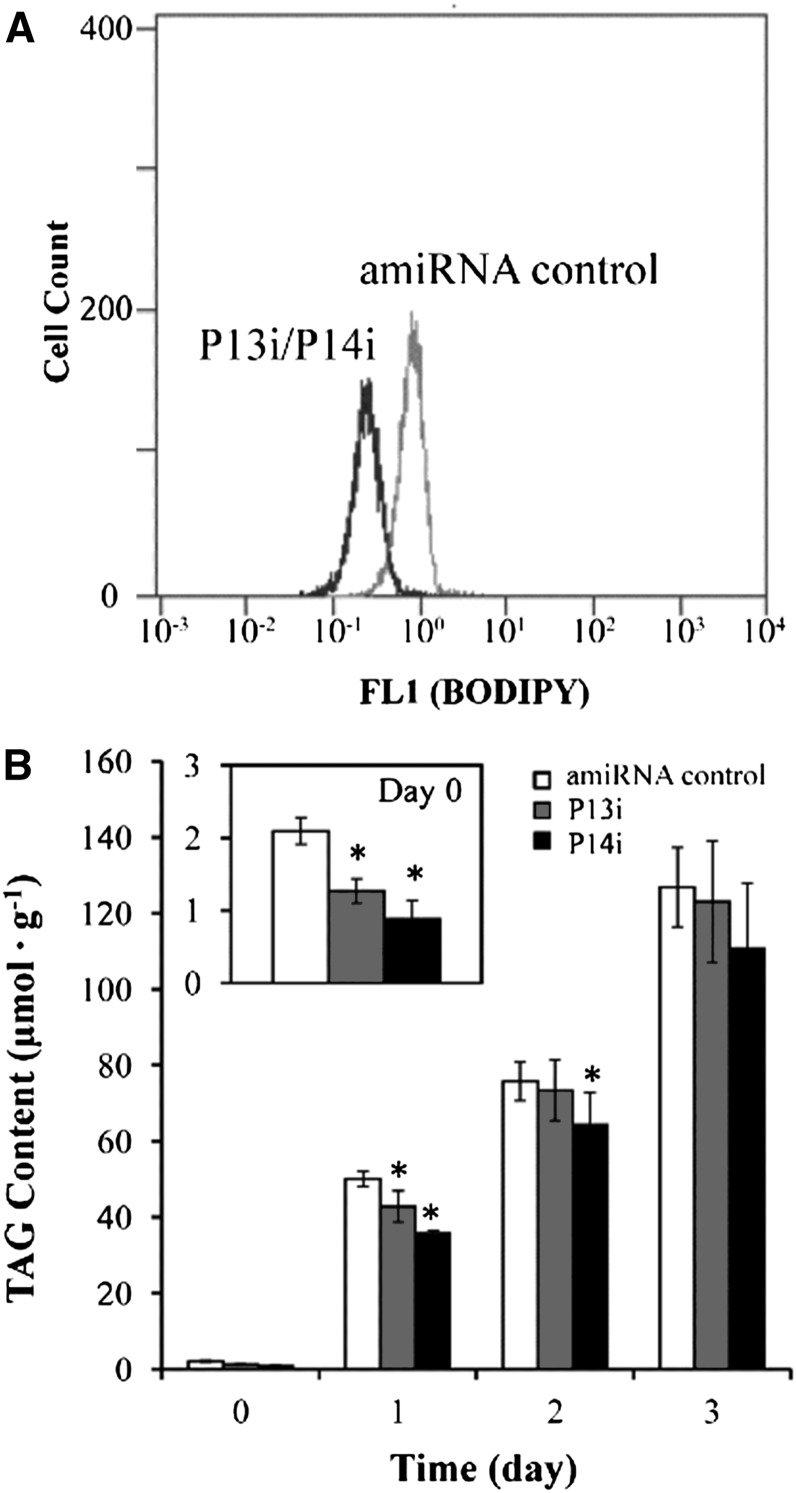
Figure 10.
PDTA Knockdown Depressed TAG Synthesis in P13i and P14i.
(A) Flow cytometry histogram illustrating the TAG content of the cell population measured as BODIPY fluorescence concentration (FL1) in situ.
(B) Total TAG concentration under N-replete and N-depleted conditions in amiRNA knockdown mutants (P13i and P14i) and control cells. Cells grown in TAP medium for 4 d were transferred to TAP-N medium to induce TAG synthesis, which is presented as day 0 (before induction). Data are presented as means ± se (n = 4 to 6), with asterisks indicating P < 0.05.

