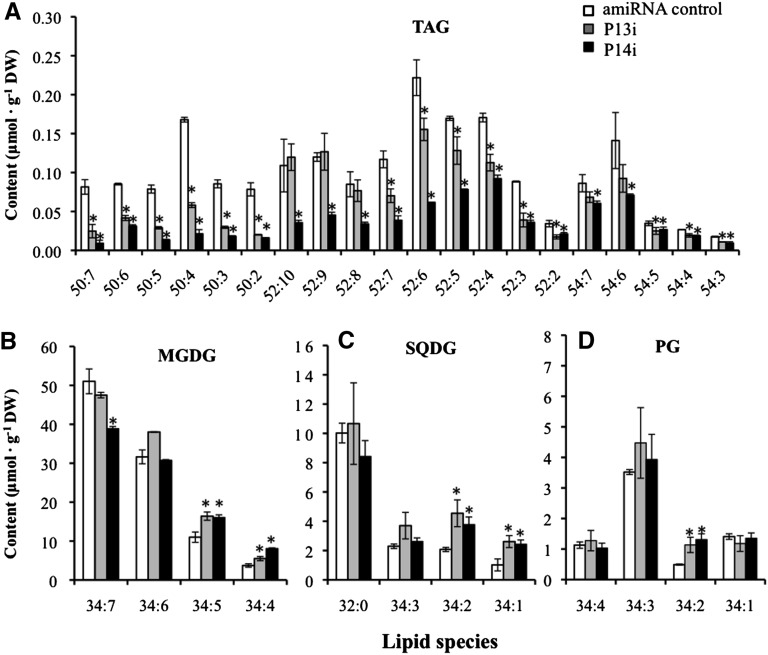
Figure 11.
The Concentrations of Lipid Molecular Species in amiRNA Knockdown Mutants (P13i and P14i) and Controls Transformed with an amiRNA Empty Vector under N-Replete Conditions.
Concentrations of TAG (A), MGDG (B), SQDG (C), and PG (D) molecular species. Algal cells grown in TAP medium for 4 d were used for ESI-MS analysis. The lipid molecular species are presented as the number of carbon atoms:total double bonds in the fatty acyl groups. Data are presented as means ± se (n = 4 to 6), with asterisks indicating P < 0.05. DW, dry weight.

