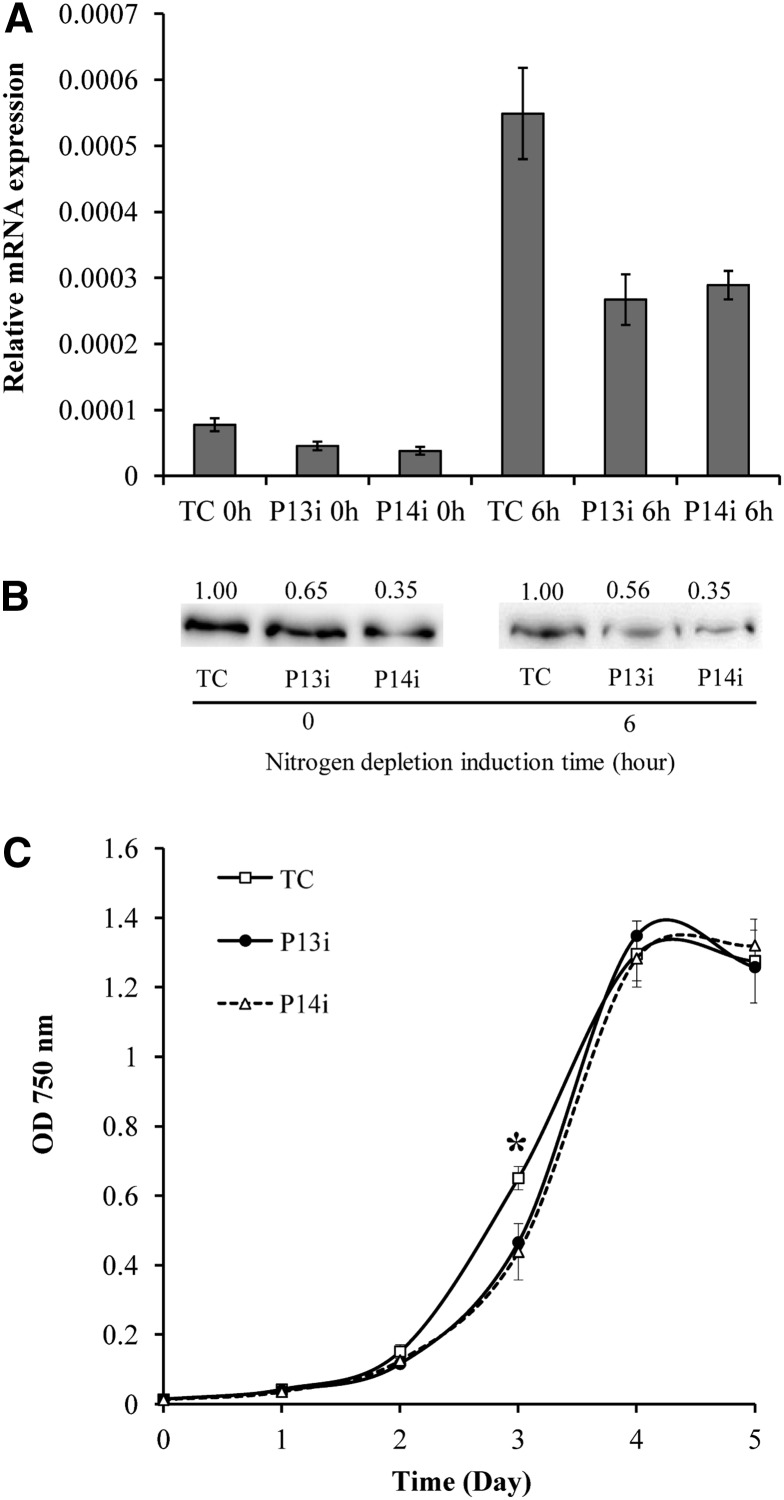
Figure 9.
Generation of amiRNA Knockdown Mutants.
(A) Knockdown of Cr-PDAT in P13i and P14i compared with the control transformed with an empty vector (TC), confirmed with real-time PCR.
(B) Immunoblotting analysis of protein level in the knockdown mutants and the control (TC). Protein concentration was determined using Image J software and normalized to the control.
(C) Growth kinetics of the knockdown mutants (P13i and P14i) and the control (TC) under N-replete conditions. Data are presented as means ± se (n = 4 to 6), with the asterisk indicating P < 0.05.

