Figure 1.
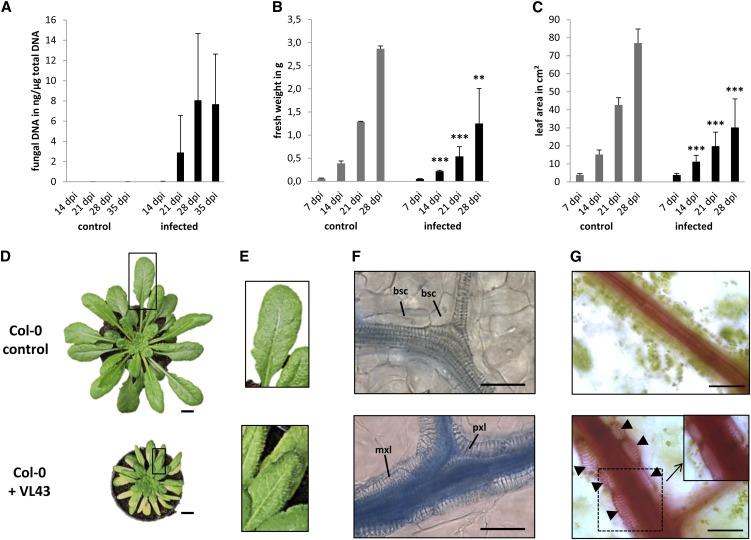
V. longisporum Strain VL43 Infection Results in Stunting and Induces Transdifferentiation of Bundle Sheath Cells to Functional TEs.
Arabidopsis Col-0 plants were mock-inoculated with water (control) or incubated in a conidial suspension of VL43 by dipping. Symptom development was analyzed at the indicated time points.
(A) Quantification of fungal DNA in infected plants; data represent means ± sd (n = 3; pools of three plants were analyzed per time point, the experiment was repeated three times, and representative data are shown). dpi, days postinoculation.
(B) Fresh weight of noninfected control and infected plants.
(C) Stunting of infected plants documented by measuring leaf areas.
(B) and (C) Data represent means ± sd (n = 18, experiments were repeated three times, and representative data are shown). Significant differences between noninfected control and infected plants at P ≤ 0.01 and P ≤ 0.001 are indicated by ** and ***, respectively.
(D) Typical macroscopic phenotype of control and infected plant at 28 DAI. Rectangles designate zoomed-in areas shown in (E).
(E) Vein clearing in leaves of infected plants. Note the yellow appearance of secondary veins in the bottom image. Control (Top) and infected plant (Bottom).
(F) Bright-field microscopy shows bundle sheath cell transdifferentiation at 21 DAI. Leaf vein of noninfected plant (Top) and leaf vein of infected plant (Bottom). Leaves were stained with trypan blue. Note that intensive staining of vascular bundles in the infected plants (Bottom) indicates xylem hyperplasia and is not caused by the presence of fungal hyphae. bsc, bundle sheath cell; mxl, metaxylem-like; pxl, protoxylem-like.
(G) At 21 DAI, leaves were fed with the dye safranin O to show functionality of de novo–formed xylem. Epidermis and mesophyll cells were carefully removed. The inset shows the same area as the dotted box, but with the focal plane set to the lumen of the xylem cells to show staining of xylem sap. Note the tightly associated and chloroplast-containing bundle sheath cells in the noninfected control. Control (Top) and infected plant (Bottom). Arrowheads indicate de novo–formed xylem.
Bars in (D) = 1 cm, bars in (F) and (G) = 50 μm.

