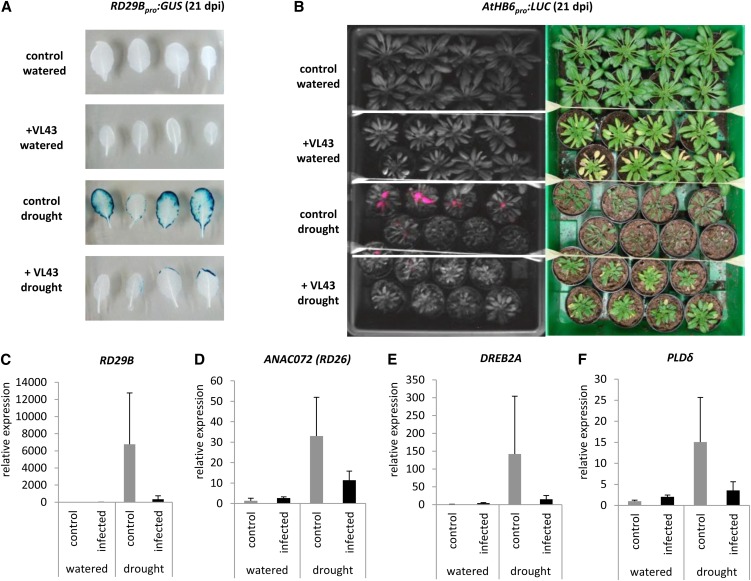
Figure 6.
Analyses of Drought Stress Reporter Lines and Drought Stress Marker Genes Reveal Reduced Responsiveness of V. longisporum Strain VL43–Infected Plants.
(A) Noninfected control and infected RD29Bpro:GUS plants were exposed to drought stress (watering stopped at 7 DAI). Histochemical GUS staining of leaves was done at 21 DAI; the experiment was repeated three times, and representative data are shown.
(B) Noninfected control and infected ATHB6pro:LUC plants were exposed to drought stress (watering stopped at 7 DAI). Luciferase activity in leaves was monitored at 21 DAI (left). Note the lower luciferase activity in infected drought-stressed plants compared with noninfected plants. Macroscopic plant phenotypes are shown on the right. The experiment was repeated two times with similar results. dpi, days postinoculation.
Real-time PCR expression analysis of RD29B (C), ANAC072 (D), DREB2A (E), and PLDδ (F) was performed in noninfected control and infected transgenic Col-0 plants at 17 DAI; data represent means ± sd (n = 3 plants per time point).

