
Fig. 5.
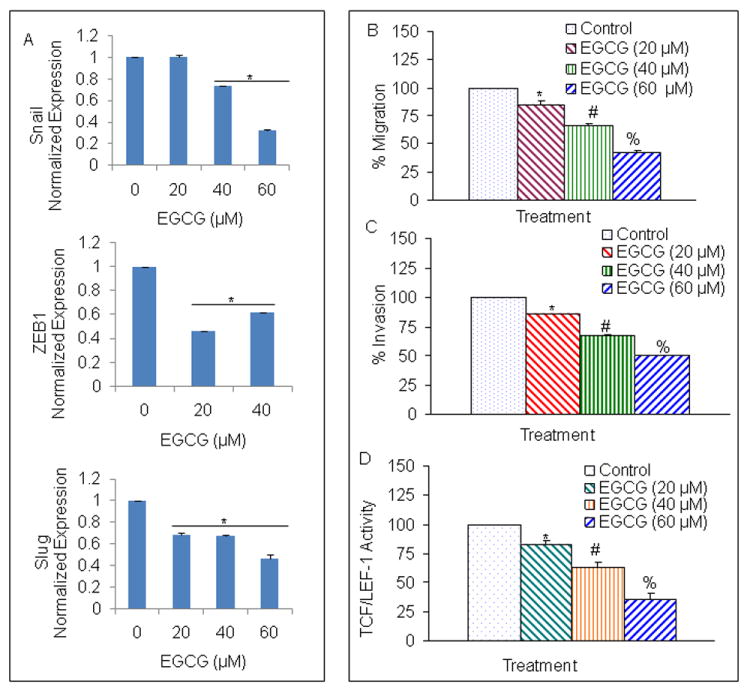
Regulation of epithelial mesenchymal transition factors, migration, invasion and TCF/LEF activity by EGCG in pancreatic CSCs. (A), Pancreatic CSCs were treated with EGCG (0-60 μM) for 48 h. At the end of incubation period, the expression of Snail, ZEB1 and Slug was measured by q-RT-PCR. Data represent mean ± SD. * = significantly different from respective controls, P < 0.05. (B), Transwell migration assay. Pancreatic CSCs were plated in the top chamber of the transwell and treated with EGCG (0-60 μM) for 24 h. Cells migrated to the lower chambered were fixed with methanol, stained with crystal violet and counted. Data represent mean ± SD. * # or % = significantly different from respective controls, P < 0.05. (C) Matrigel invasion assay. CSCs were plated onto the Matrigel-coated membrane in the top chamber of the transwell and treated with EGCG (0-60 μM) for 48 h. Cells invaded to the lower chambered were fixed with methanol, stained with crystal violet and counted. Data represent mean ± SD. *, # or % = significantly different from respective controls, P < 0.05. (D), Effects of EGCG on TCF-1/LEF activity. Pancreatic CSCs were transduced with TCF/LEF responsive GFP/firefly luciferase viral particles (pGreen Fire1-Gli with EF1, System Biosciences). Transduced CSCs were treated with EGCG (0-60) for 48 h and the GFP fluorescence was measured. Data represent mean ± SD. *, # or ** = significantly different from control, P < 0.05.