
Fig. 6.
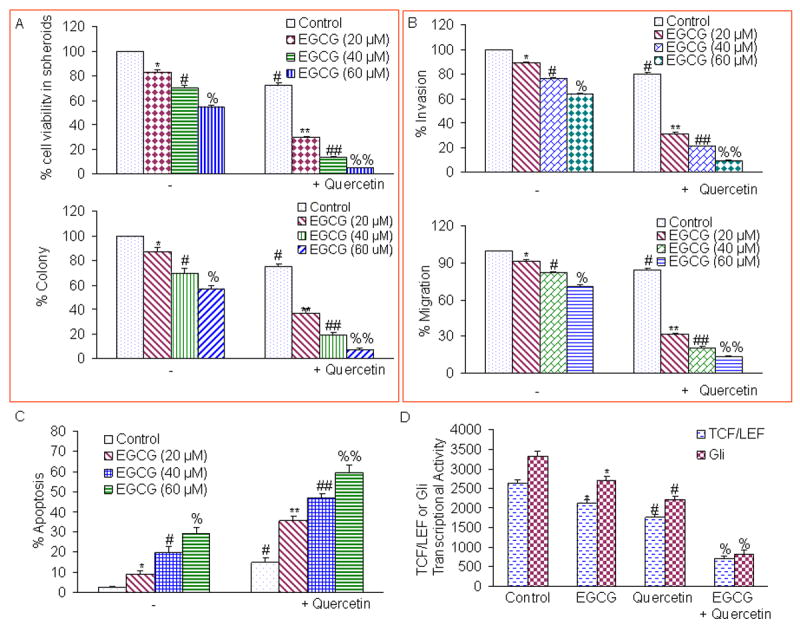
Quercetin synergizes with EGCG to inhibit self-renewal capacity, invasion, migration, and TCF/LEF and Gli transcriptional activities in pancreatic CSCs. (A), Effects of EGCG and quercetin on spheroid and colony formation. Upper Panel, Quercetin synergizes with EGCG to inhibit spheroid’s cell viability. CSCs were seeded in suspension and treated with EGCG (0-60 μM) with or without quercetin (20 μM) for 7 days. At the end of incubation period, all the spheroids were collected and resuspended. Cell viability was measured by trypan blue assay. Data represent mean ± SD. *, #, %, **, ##, or %% = significantly different from control, P < 0.05. Lower panel, Quercetin synergizes with EGCG to inhibit colony formation. Pancreatic CSCs were seeded in soft agar and treated with various doses of EGCG (0-60 μM) with or without quercetin (20 μM) and incubated at 4°C for 21 days. At the end of incubation period, colonies were counted. Data represent mean ± SD. *, #, %, **, ##, or %% = significantly different from control, P < 0.05. (B), Effects of EGCG and quercetin on invasion and migration. Upper panel, Matrigel invasion assay. CSCs were plated onto the Matrigel-coated membrane in the top chamber of the transwell and treated with EGCG (0-60 μM) with or without quercetin (20 μM) for 48 hrs. Cells invaded to the lower chambered were fixed with methanol, stained with crystal violet and counted. Data represent mean ± SD. *, #, %, **, ##, or %% = significantly different from control, P < 0.05. Lower panel, Transwell migration assay. Pancreatic CSCs were plated in the top chamber of the transwell and treated with EGCG (0-60 μM) with or without quercetin (20 μM) for 48 hrs. Cells migrated to the lower chambered were fixed with methanol, stained with crystal violet and counted. Data represent mean ± SD. *, #, %, **, ##, or %% = significantly different from respective controls, P < 0.05. (C), Quercetin synergizes with EGCG to induce apoptosis. CSCs were seeded in suspension and treated with EGCG (0-60 μM) with or without quercetin (20 μM) for 7 days. At the end of incubation period, all the spheroids were collected. Apoptosis was measured by TUNEL assay. Data represent mean ± SD. *, #, %, **, ##, or %% = significantly different from control, P < 0.05. (D), Effects of EGCG and quercetin on TCF/LEF and Gli transcriptional activities. Pancreatic CSCs were transduced with either lentivirus encoding TCF/LEF responsive GFP and luciferase genes or Gli-responsive GFP and luciferase genes. Transduced CSCs were treated with EGCG (40 μM) with or without quercetin (20 μM) for 48 hrs and the luciferase activity was measured. Data represent mean ± SD. *, #, or % = significantly different from respective control, P < 0.05.