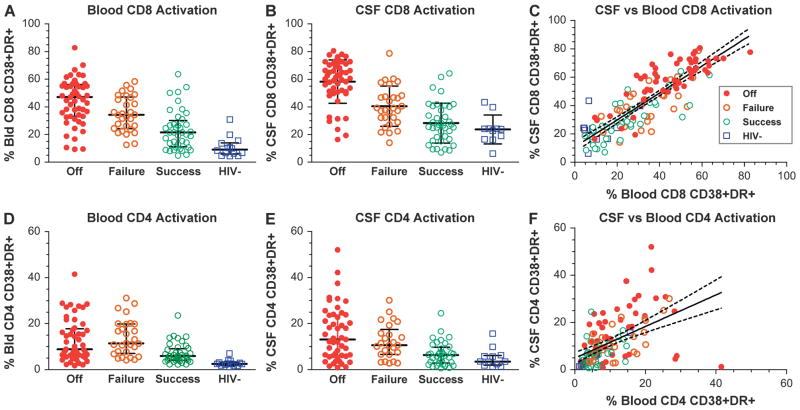
FIGURE 2.
Comparisons of CD8 and CD4 T-cell activation in blood and CSF of the 4 subject groups. A, Blood CD8 T-cell activation. Bars show medians and IQR. Highest activation was in the offs and lowest in HIV negatives. B, CSF CD8 cell activation showed similar order. C, CSF CD8 activation was highly correlated with that of blood when all groups were combined. The diagonal line shows the linear regression and 95% confidence intervals; the slope of regression was 0.95 with r2 = 0.72, P < 0.0001. D, Blood CD4 cell activation. E, CSF CD4 cell activation. F, Comparison of CSF to blood CD4 activation in all 4 groups showing regression line and 95% confidence intervals. Slope of regression is 0.67, with r2 = 0.26, P <0.0001. Symbols designate subject groups as in C.

