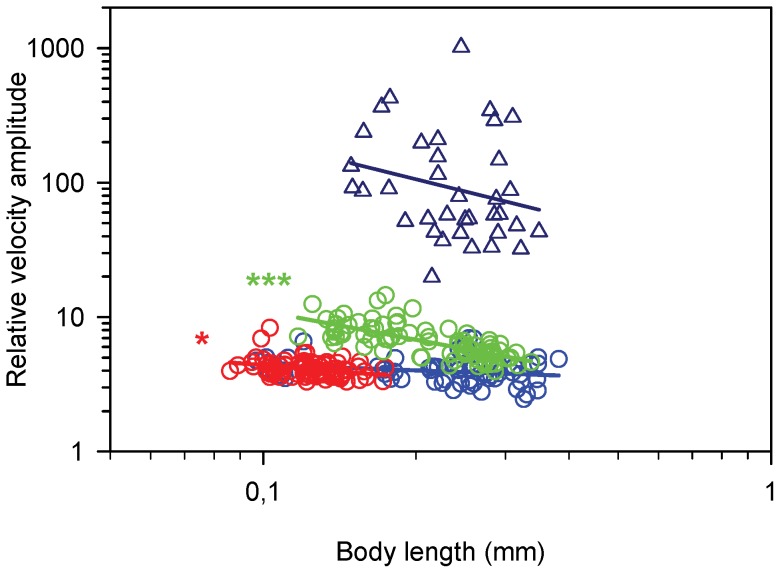
Figure 6. Relative velocity fluctuation (RLF), as function of body length (BL) in nauplii.
RLF = (maximum velocity – minimum velocity)/average velocity). Regression lines are power laws fitted to the data. Blue circles, T. longicornis: Log(RLF) = −0.13Log(BL) +0.51 (r2 = 0.06, p = 0.12, n = 63); red circles, O. davisae, Log(RLF) = −0.31Log(BL) +0.34 (r2 = 0.10, p = 0.01, n = 82); green circles, A. tonsa, Log(RLF) = −0.71Log(BL) +0.34 (r2 = 0.50, p<0.0001, n = 82); blue triangles, T. longicornis swimming (slope = −0.93, p = 0.49, n = 36).

