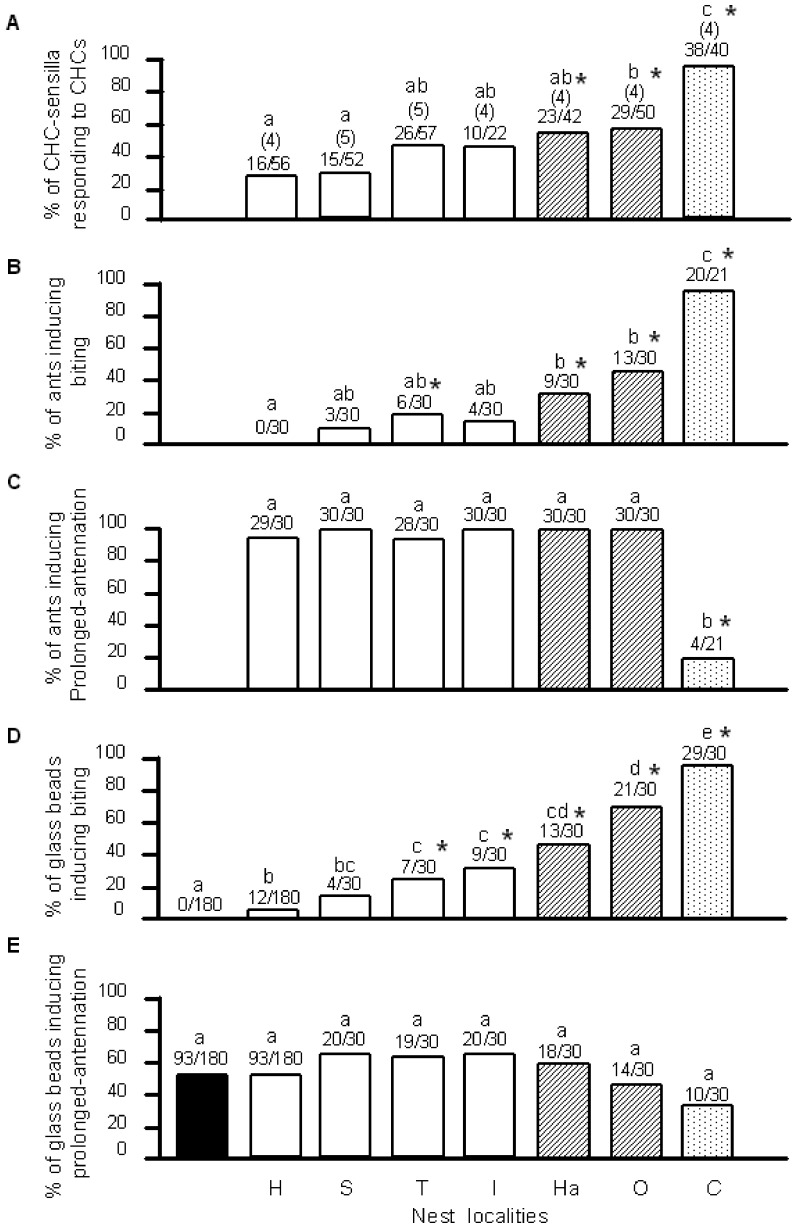
Figure 5. Ratios of activated sensilla and behavioral responses of “Hoshioki” workers to live or surrogate ants.
(A) Percentage of CHC sensilla in “Hoshioki” workers showing an electrophysiological response to CHCs of workers of F. yessensis from nests within (white columns) and outside (hatched columns) the “Ishikari supercolony”, and C. japonicus CHCs (dotted columns). The fractions indicate the number of sensilla responding to the stimulus CHCs per total number of sensilla tested. The numbers in parentheses indicate the number of ants used. (B) Percentage of workers from the above nests (out of the total workers tested, respectively) that induced biting behavior of “Hoshioki” workers. (C) Percentage of workers from the above nests (out of the total workers tested, respectively) that induced prolonged-antennation behavior of “Hoshioki” workers. (D) and (E) are same as (B) and (C) but using surrogate invader ants made of glass beads coated with purified CHC. Black columns describe the response to n-hexane control. Different letters indicate significant differences by Tukey WSD test, respectively in plates A–E. Asterisks indicate significant differences from the control levels responding to “Hoshioki” workers or their CHCs by one-sided Fisher’s exact test with Bonferroni-Holm correction.

