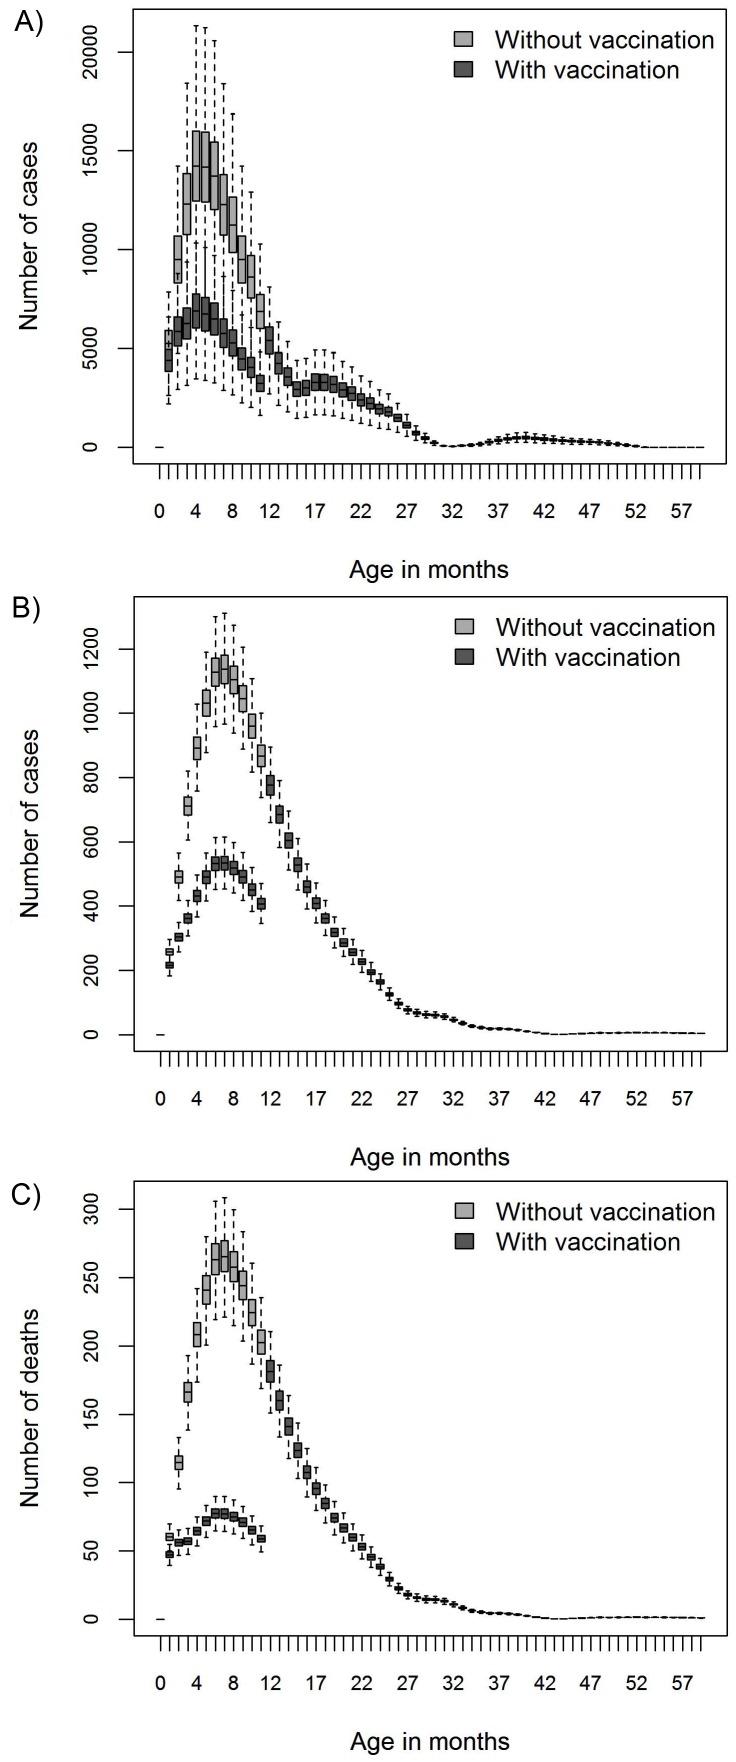
Figure 2. The health care use associated with rotavirus in Kenya, by month of age, observed before (light grey bars) and predicted after (dark grey bars) introduction of a rotavirus vaccine.
The panels represent the number of outpatient clinic visits (panel a), hospital admissions (b) and deaths (c). The figures are representative for both Rotarix and RotaTeq as an identical efficacy was assumed.

