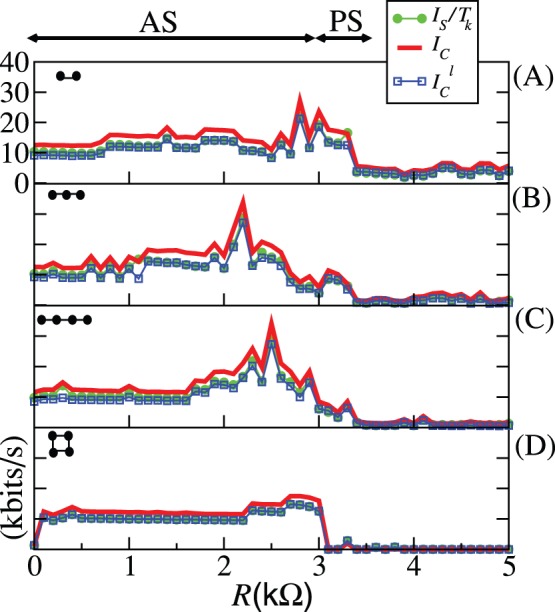
Figure 3. Results for experimental networks of Double-Scroll circuits.

On the left-side upper corner pictograms represent how the circuits (filled circles) are bidirectionally coupled.  as (green online) filled circles,
  as the (red online) thick line, and
  as the (blue online) squares, for a varying coupling resistance
  . The unit of these quantities shown in these figures is (kbits/s). (A) Topology I, (B) Topology II, (C) Topology III, and (D) Topology IV. In all figures,
  increases smoothly from 1.25 to 1.95 as
  varies from 0.1k
 to 5k
to 5k . The line on the top of the figure represents the interval of resistance values responsible to induce almost synchronisation (AS) and phase synchronisation (PS).
