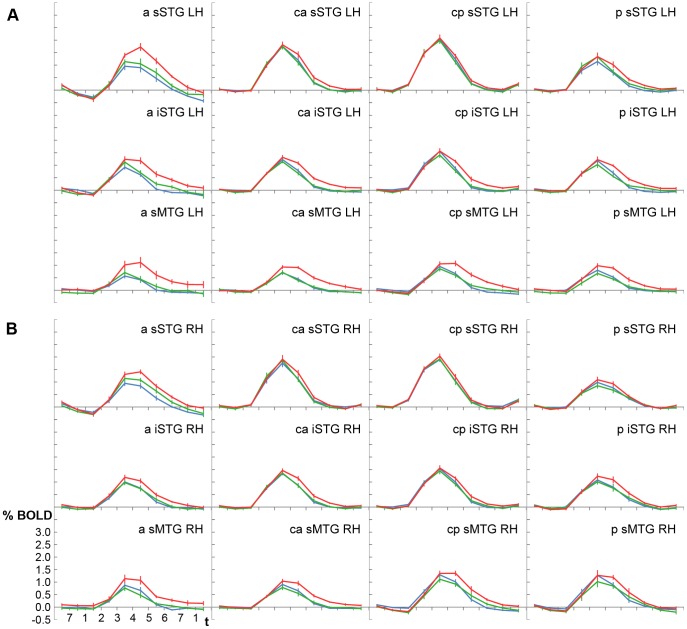
Figure 3. Experiment 1– Averaged BOLD signal time courses shown for all regions-of-interest in the left (A) and right (B) hemisphere.
Time t is given as the duration to scan one volume (2 s). Blue = unfamiliar voices, green = familiar voices, red = named voices. Regions: a, anterior; ma, mid-anterior; mp, mid-posterior; iSTG, inferior part of the STG; LH, left hemisphere; p, posterior; RH, right hemisphere; sMTG, superior part of the MTG; sSTG, superior part of the STG.

