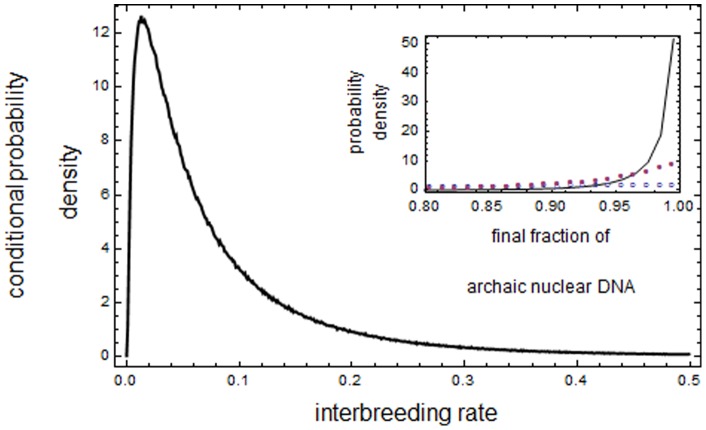
Figure 3. The probability density for  .
.
We show here the probability density that the final value of  is in the experimental interval 0.96–0.99 as a function of
  . The plot was built by obtaining one million “successful” pairs
  such that subpopulation 2 is extinct and the final value of
  – obtained by solving (1) – lies in the experimental interval. These pairs were obtained out of a total of around 140 million simulated Wright-Fisher paths
  with random
  uniformly distributed between 0 and 0.8 and
  uniformly distributed between 0 and 2. For the successful pairs we then computed the fraction associated to any given
  . In the inset we plot the probability density for the final values of
  for three different values of
  . The densities are empirically determined by simulating 400,000 Wright-Fisher paths
  with random
  uniformly distributed between 0 and 1 and selecting the histories in which subpopulation 2 is extinct. The empty dots (blue) are data for
  , the full dots (purple) are data for
  and the full curve (black) are for
  .
.

