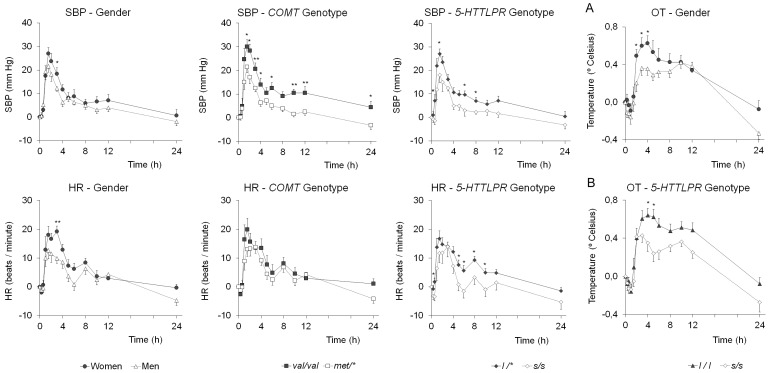
Figure 2. Influence of gender and genetics (COMT, 5-HTTLPR) on the temporal course of systolic blood pressure (upper-left panel), heart rate (lower-left panel), and oral temperature (right-end panel) (mean ± SEM); women n = 12 vs. men n = 15; COMT, val/val n = 8 vs. met/* n = 18; 5-HTTLPR, l/* n = 18 vs. s/s n = 9).
*p<0.05, **p<0.01. Graph A corresponds to gender differences in OT, graph B corresponds to differences in OT as a function of 5-HTTLPR polymorphisms (l/l n = 11 vs. s/s n = 9). Subjects l/s (n = 7) are not represented for graph clarity, but data almost fully overlaps with the s/s trace.

