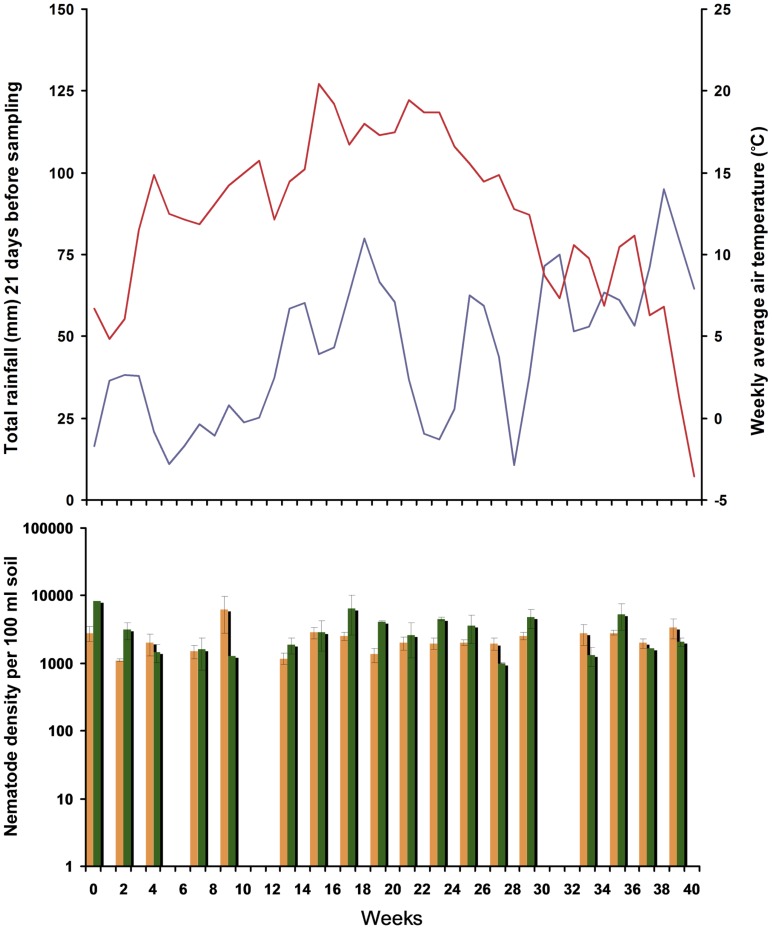
Figure 1. Precipitation and temperature in relation to total nematode densities in open (field) and closed (forest) canopies.
Weekly averages of daily temperature (red) and total rainfall over 21 days before sampling (blue) as measured by the Royal Dutch Meteorological Institute (KNMI) are shown above. At the bottom, average nematode densities per 100 ml of soil from a since 25 years abandoned arable field (open canopy, yellow bars) and adjacent pristine beech forest (close canopy, green bars) are given. Sites sampled in 2009 at regular intervals between March 17 (week 1) and December 18 (week 39).

