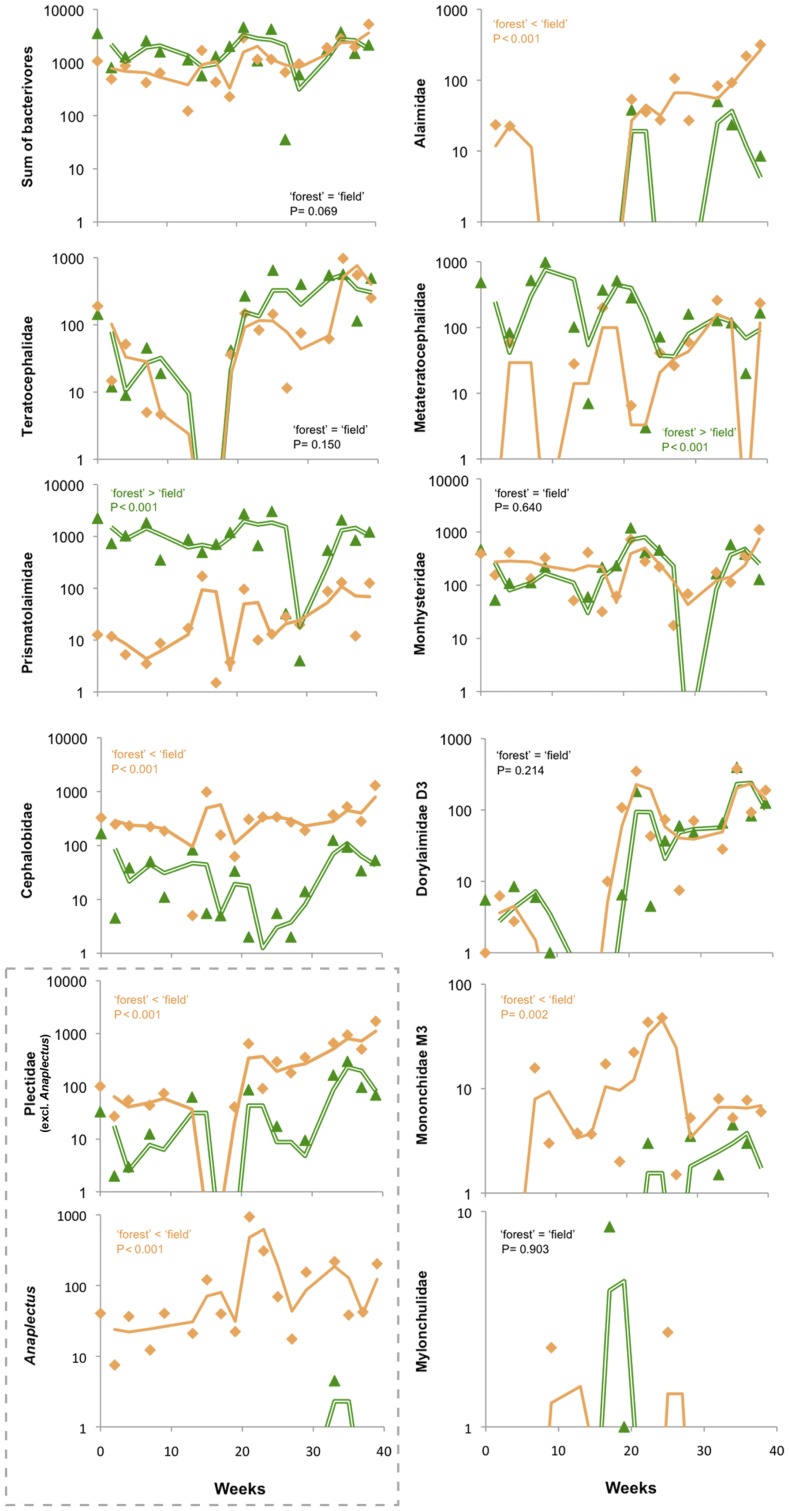
Figure 2. Temporal patterns of bacterivorous, omnivorous and predatory nematode families.
We determined DNA-based variation in the nematode densities per 100 ml soil (note differences in y-axes) of representatives from seven bacterivorous families: Teratocephalidae, Prismatolaimidae, Cephalobidae, Plectidae (i.e., all Plectidae excl. Anaplectus and ‘Anaplectus’, both in a dashed gray box), Alaimidae, Metateratocephalidae, Monhysteridae; the omnivorous family Dorylaimidae (D3 region sensu [65]); and the predatory families Mononchidae (M3, [65]) and Mylonchulidae. Sampling weeks as x-axes (constant scales); samples from the field are represented by orange triangles and samples from the forest by green diamonds. Trends are given as two-period moving averages: the averaged 2nd and 3rd data points are portrayed by the 1st data point and so forth.

