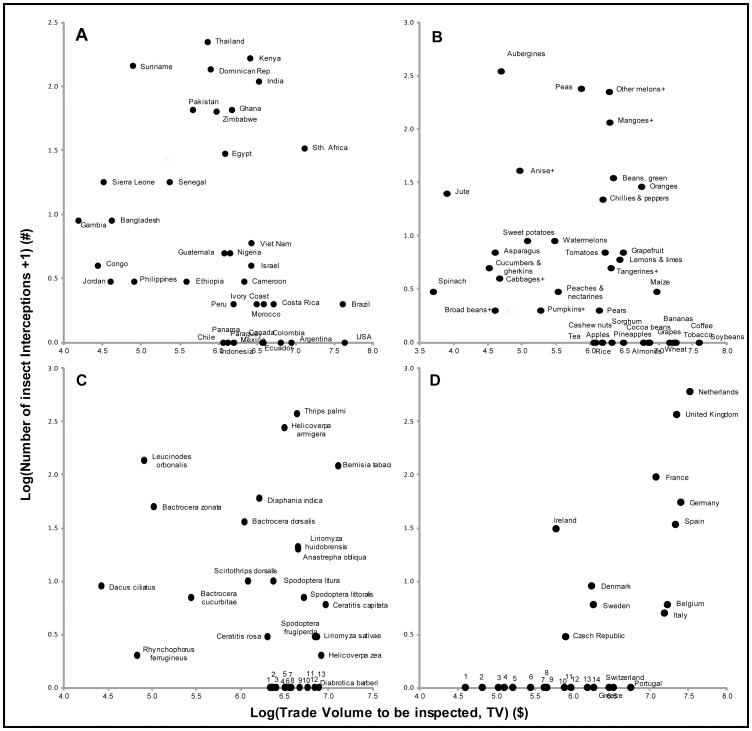
Figure 2. Trade volume and the number of interceptions.
The relationship between the Trade Volume to be inspected (TV) and the number of alien insect interceptions at Europe’s borders on agricultural imports (2003–2007), by A) country of origin (r = 0.02, n = 146, p = 0.810), B) commodity type (r = −0.01, n = 126, p = 0.910), C) alien insect species (r = 0.23, n = 116, p = 0.013) and D) European importing countries (positive correlation, r = 0.73, n = 28, p = 0.00001). Only the top 25 data points by TV and number of interceptions are displayed. Notes: B) +see Table S5 for full FAO commodity names. C) 1 = Cacoecimorpha pronubana, 2 = Pheletes californicus, 3 = Tetranychus evansi, 4 = Spodoptera eridania, 5 = Frankliniella occidentalis, 6 = Unaspis citri, 7 = Opogona sacchari, 8 = Rhynchophorus palmarum, 9 = Metamasius hemipterus, 10 = Liriomyza trifolii, 11 = Anastrepha fraterculus, 12 = Maconellicoccus hirsutus, 13 = Aleurocanthus woglumi (see Table S3 for taxonomy). D) 1 = Luxembourg, 2 = Latvia, 3 = Estonia, 4 = Slovakia, 5 = Malta, 6 = Cyprus, 7 = Lithuania, 8 = Hungary, 9 = Slovenia, 10 = Bulgaria, 11 = Austria, 12 = Finland, 13 = Romania, 14 = Poland.

