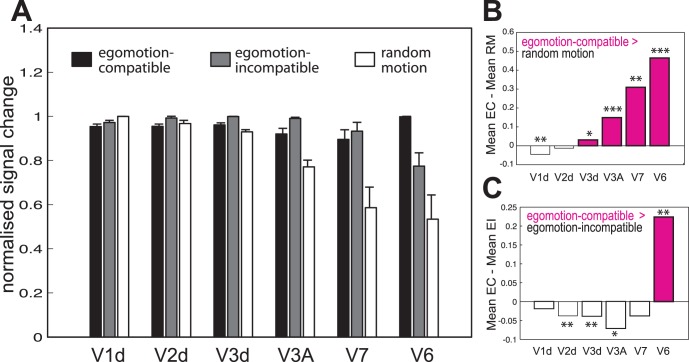
Figure 2. ROI analysis.
A) For each hemisphere, the average percent signal change was obtained across all the voxels in each retinotopically defined ROI. The bars represent the mean normalised signal change across hemispheres, ±1 S.E.M., for each of the experimental conditions. B and C) Response obtained by subtracting the mean response in RM (B) and EI (C) from the mean EC response. Positive values represent a higher response for the EC condition. *p<0.05; **p<0.005; ***p<0.001.

