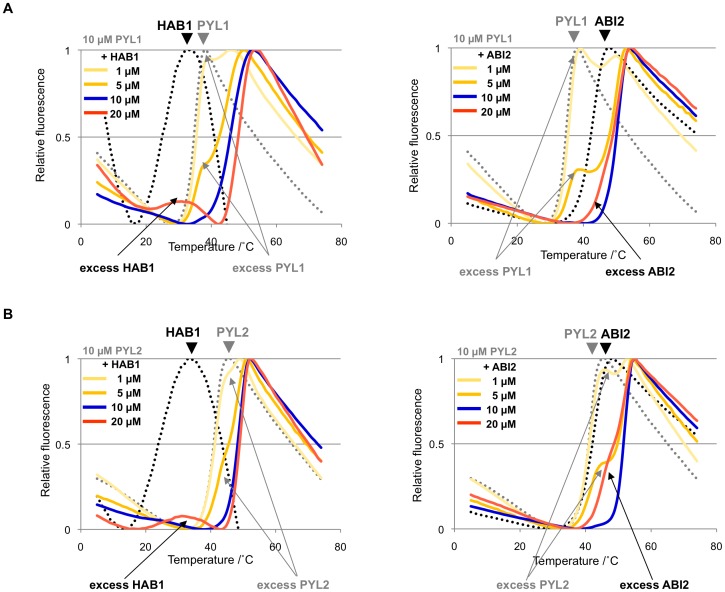
Figure 7. Stoichiometry of receptor/ligand-phosphatase complexes.
Transition curves of ABA-bound PYL1 and PYL2 in the presence of increasing amounts of HAB1 and ABI1 PP2Cs. The melt curves for receptors in the absence of PP2Cs (dashed grey lines ) and PP2Cs in the absence of receptors (dashed black lines ) are shown as references. The positions of uncomplexed, excess receptors and PP2Cs are indicated by arrows. Each panel shows titrations of 10 µM receptor with PP2Cs at 1 µM (pale yellow line), 5 µM (yellow line), 10 µM (blue line) and 20 µM (orange line) PP2C. (A) PYL1/ABA titrated with HAB1 (left) and ABI2 (right). (B) PYL2 titrated with HAB1 (left) and ABI1 (right).

