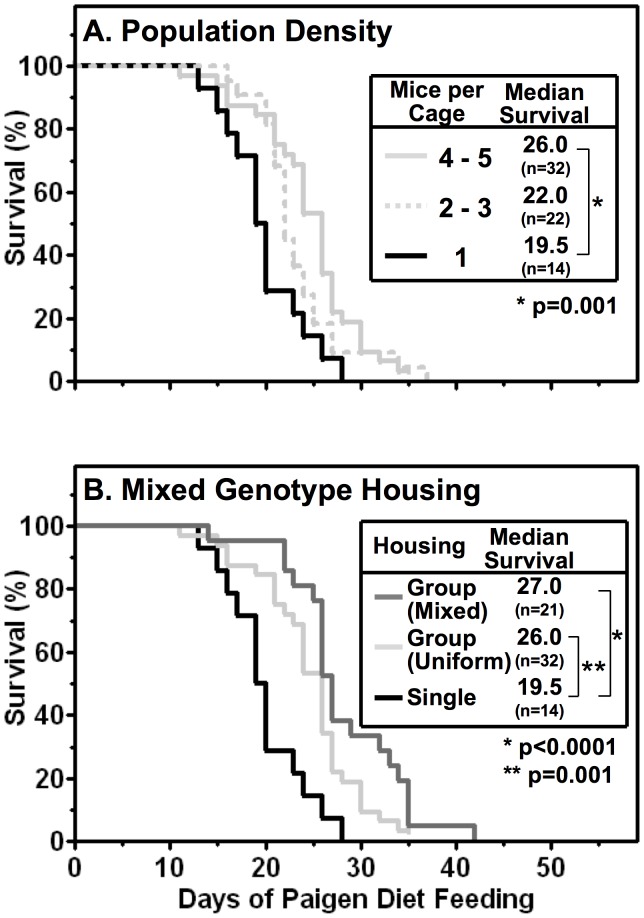
Figure 3. Population density (A) and mixed genotype housing (B) effects on Paigen diet-fed HypoE mouse survival.
Mice were housed at the indicated population densities (1, 2–3 or 4–5 (group)/cage) with either uniform (HypoE) or mixed genotypes (HypoE and one or more SRBI+/−ApoeR61h/h littermates per group). Beginning at two months of age the animals were switched from a normal chow diet to the standard Paigen diet. The data shown include only the HypoE mice. A Kaplan-Meier survival curves for HypoE mice housed singly (1 mouse/cage, black line), or uniform genotype (HypoE only) groups of 2–3 (light gray dashed line), or 4–5 (light gray solid line) mice per cage with the indicated median survival times and number of animals per group (n). A notch in the 4–5 mice per cage line indicates a censored animal that was euthanized due to severe ulcerative dermatitis at 35 days after initiating Paigen diet feeding. B Kaplan-Meier survival curves for HypoE mice housed singly (black line) or in uniform genotype (HypoE only, light gray line) or mixed genotype (HypoE and SRBI+/−ApoeR61h/h E, gray line) group housing (4–5 mice/cage).

