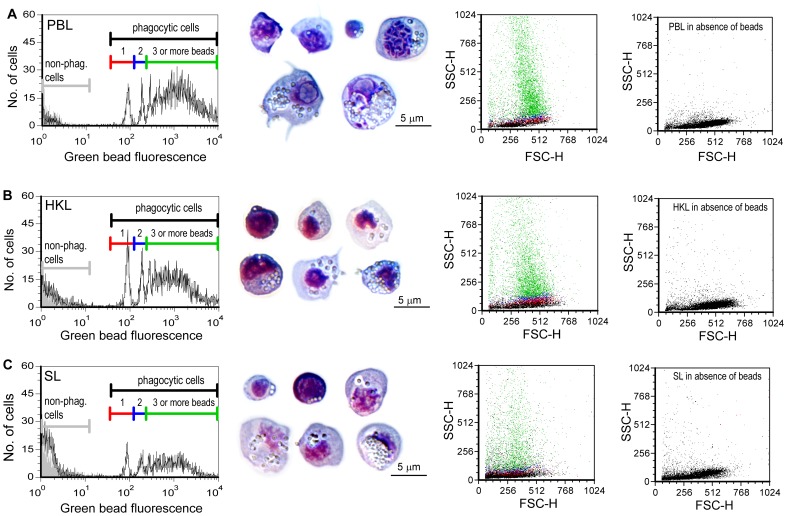
Figure 5. The phagocytic capacity of isolated leucocytes is high.
FL1 (green bead fluorescence) histograms (left) showing phagocytic capacity of PBL (A), HKL (B) and SL (C) incubated with fluorescent beads (1 µm) for 4 h. Increased peak fluorescence indicates an increased number of ingested beads. Picture insets show cells stained with Colorrapid from PBL, HKL and SL samples that have ingested various numbers of beads. The left dot plots show cells in the red (cells with 1 bead) blue (cells with two beads) and green (cells with 3 or more beads) and black (non-phagocytic cells) regions; cells with a higher number of ingested beads have a higher granularity (SSC-value). The dot plots to the right show the light scatter properties of the cells incubated without beads at the instrument settings used for the phagocytosis assay.

