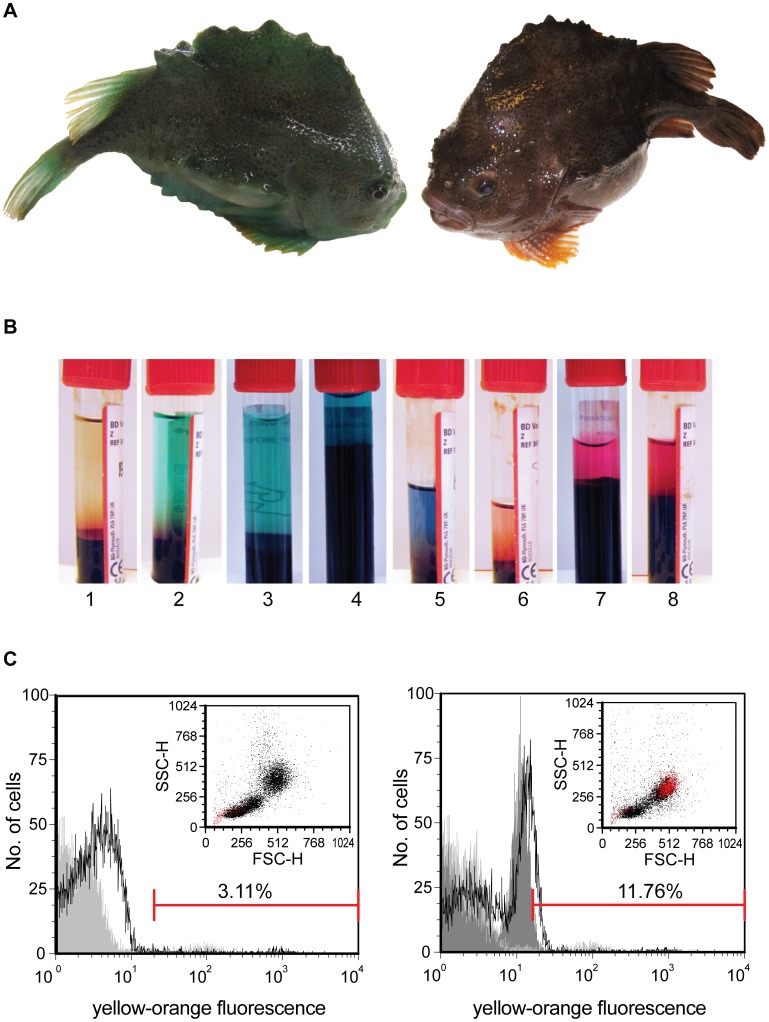
Figure 8. PBL samples from fish with purple/red serum give yellow-orange autofluorescence in flow analyses.
The lumpsuckers varied in color from green to brown and red (A). Samples of serum from different fish (B). Histograms and dot plots (insets) when PI is added to leucocytes (C). In histogram: Gray without PI and black with PI. Horisontal bars show PI positive cells. This sample is used for gating of live cells to exclude dead cells from the analyses. The left figure in C shows PI positive cells (red dots) in dot plot for PBL from the green lumpsucker giving serum no 3, while the right figure shows the same results for the brown/red fish giving serum no 7. Note the difference in the yellow-orange fluorescence (red dots in C) for these two PBL samples.

