
Figure 5. Effect of spatial resolution on positive predictive value (PPV).
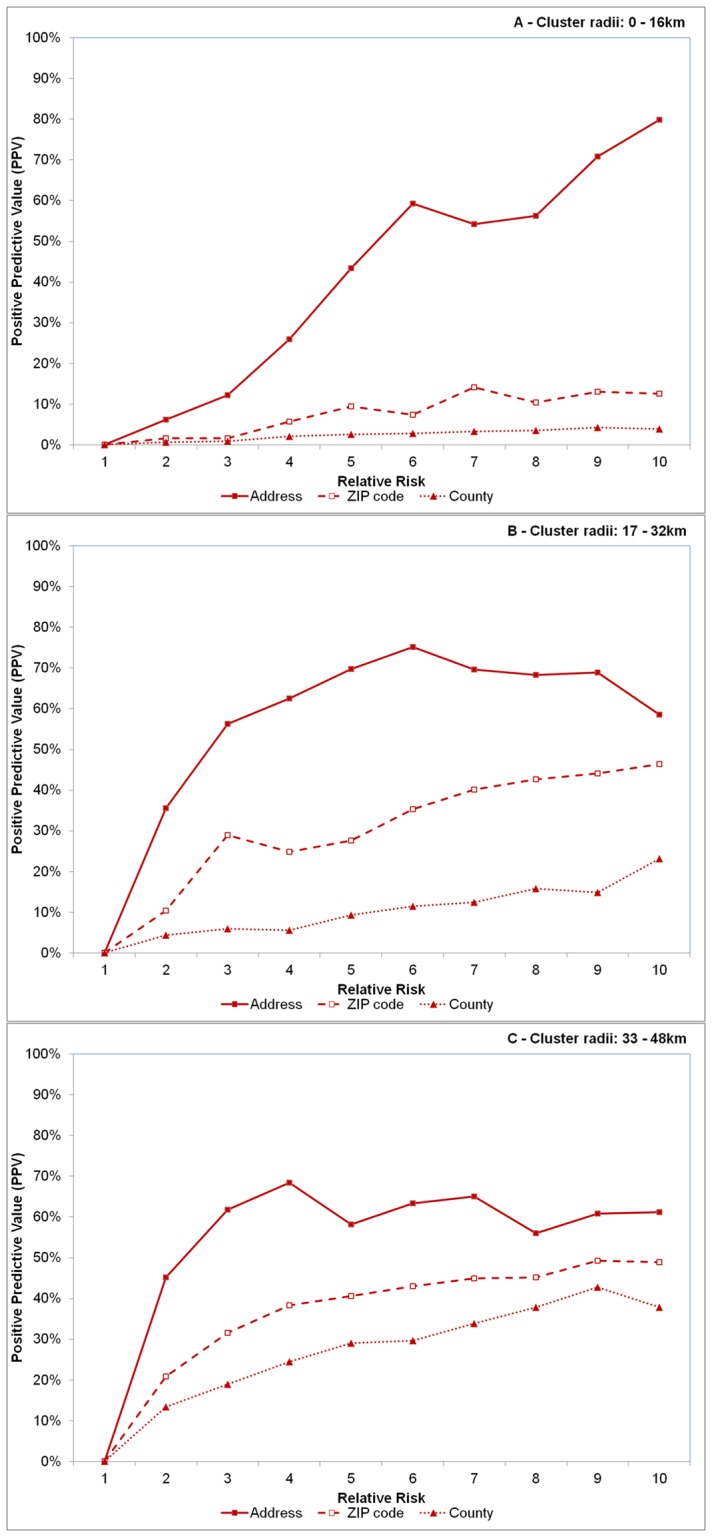
Effect of spatial resolution on positive predictive value (PPV), defined as the proportion of observations in the detected significant clusters and of the artificial cluster for varying sizes of cluster radii of 0–16 km (A), 17–32 km (B) and 33–48 km (C). Each line represents disease case data aggregated to different spatial resolutions – the address level (solid line with solid squares), the ZIP code level (dashed line with open squares) and county level (dotted line with triangles). Relative risk (abscissa x-axis) describes the intensity of the artificially created clusters, where RR = 1 indicates the risk of a disease case occurring inside the cluster area is equivalent to that of occurring outside the cluster area (see Fig. 1). RR = 10 indicates risk is 10 times higher inside the cluster area relative to outside the area.