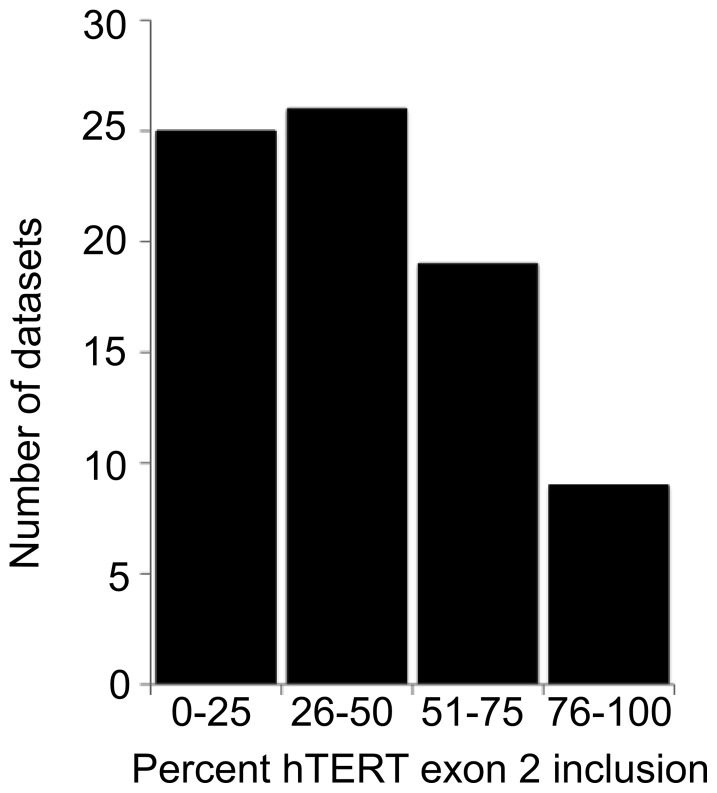
Figure 5. hTERT exon 2 is underrepresented relative to the flanking exons in deep sequencing datasets.
The percent inclusion of hTERT exon 2, relative to either exon 1 or exon 3 (whichever was higher) was determined from 78 deep sequencing datasets. Datasets were binned into inclusion rates of 0–25%, 26–50%, 51–75% and 76–100%. TERT from ES cells contained high levels of exon 2, in contrast to other cell lines and primary tissues.

