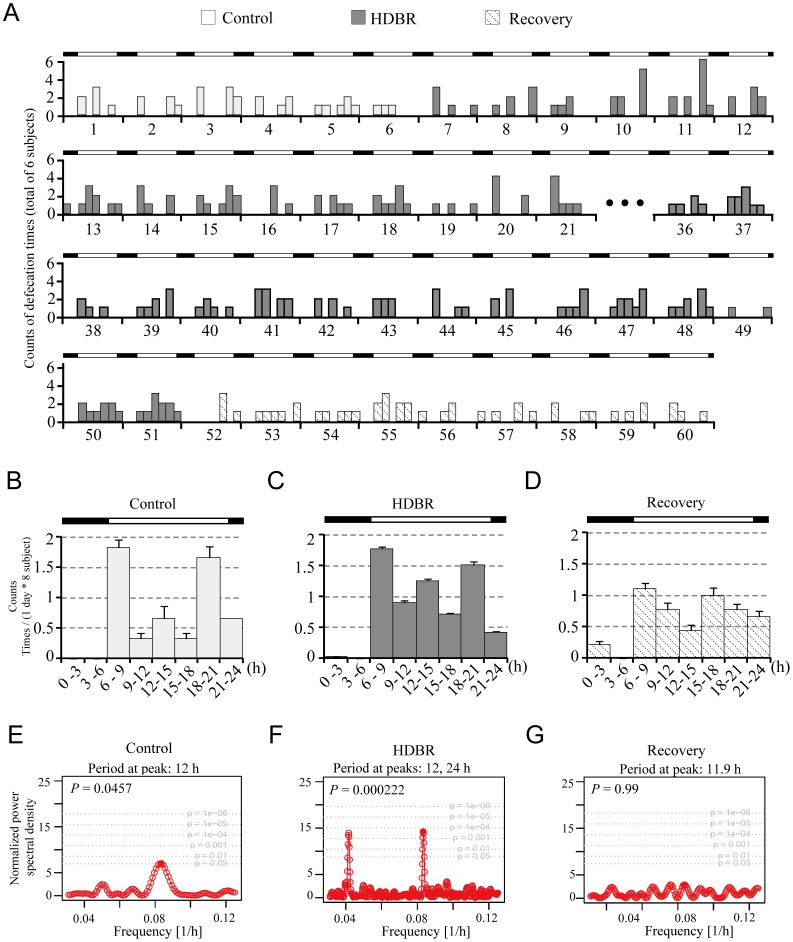
Figure 3. Change in defecation patterns before, during and after HDBR.
A: Actogram of defecation counts. Data were taken from six subjects, and defecation counts were tallied and displayed every 3 h for 46 days. B – D: Average daily defecation counts. The data were aligned along one cycle (24 h). Data are means ± SD. E – G: Lomb-Scargle periodograms for the control, HDBR and recovery periods. Data were taken from 6 subjects, and defecation counts were tallied and displayed every 3 h for 63 days. Control is labelled in green, HDBR in orange and recovery in blue. Black bars denote lights-off time (22∶00 to 06∶00), and white bars denote lights-on time (06∶00 to 22∶00). Note that the data from days 22 to 35 and days 61–63 were incomplete and thus excluded from the analysis. P values indicate the statistical significance of the peaks.

