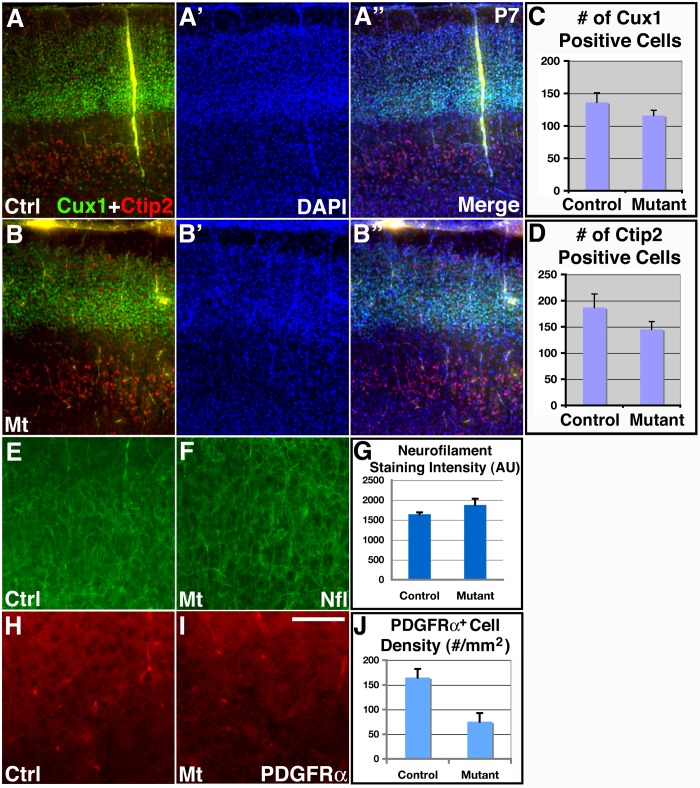
Figure 4. Relatively normal neurogenesis and neuronal differentiation in class II orc3/hGFAP-cre mutant cortices.
(A–B”) Normal expression of layer specific neuronal markers as well as relatively normal number of neurons in orc3 mutant cortices at P7. Upper layer neurons were stained using ant-Cux1 antibodies (green in A, A”, B & B”), while lower layer neurons were stained using anti-Ctip2 antibodies (red in A, A”, B & B”). No obvious differences were observed in the numbers of Ctip2 and Cux1positive neurons between controls (A–A”) and mutants (B–B”). (C–D) Quantification of Cux1 and Ctip2 positive neurons in control and mutant cortices. No significant differences were observed between controls and mutants in either the number of Cux1 positive cells per cortical width of 77 μm (control, 131.1±14.8; mutant, 115.9±8.2; P = 0.26; n = 7), or the number of Ctip2 positive cells per cortical width of 660 mm (control, 187.0±25.7; mutant, 145.3±14.6; P = 0.22; n = 4). (E–G) Normal neuronal differentiation in orc3 mutant cortices at P7 as assessed by anti-neurofilament staining. No obvious differences were observed between controls (F) and mutants (E). Quantitative analysis also revealed no statistically significant differences (control, 1644±47; mutant, 1877±156; P = 0.23, n = 3) in staining intensity (AU, arbitrary unit) (G). (H–J) Reduced oligodendrocyte production in orc3 mutant cortices at P7. PDGFRα staining revealed reduced numbers of positive cell bodies in mutants (I) as compared to controls (H). Quantification confirmed reductions in PDGFRa positive cell body density in mutants (control, 164.8±17.4; mutant, 75.3±17.6; P = 0.002, n = 12) (J). Scale bar in (I), 200 μm for (A–B') and (E–F), 50 μm for (H–I).

